

Polygon (POL) Eyes Reversal: Support Bounce Could Push Price Toward $0.680
- Polygon (POL) is in a downtrend, losing 3.11% in 24 hours.
- Strong support near $0.16 offers potential low-risk entry.
- A price bounce could reach targets of $0.215, $0.245, and $0.280.
- Indicators show bearish momentum, but a possible rebound may emerge.
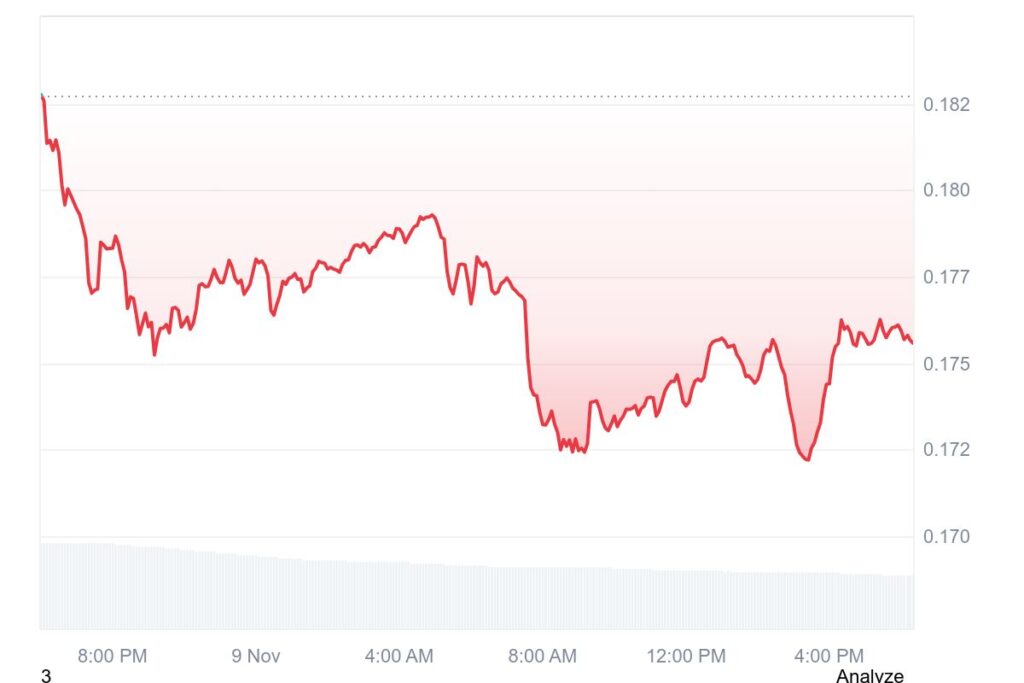
Polygon (POL) is currently on a downward trend, dropping 3.11% over the past 24 hours. Over the last week, POL has declined by 8.92%, reflecting weakening momentum and increased bearish sentiment among traders.
 Source: CoinMarketCap
At the time of writing, POL is trading at $0.1757, with a 24-hour trading volume of $98.26 million, down 37.93%. Its market capitalization stands at $1.85 billion, showing a 3.12% decrease. Overall, the coin faces market pressure, signaling cautious investor behavior amid recent losses.
Also Read: Polkadot Price Shows Strength While Attention Builds Ahead of November Event
Polygon Bounce Setup: Key Support and Target Levels
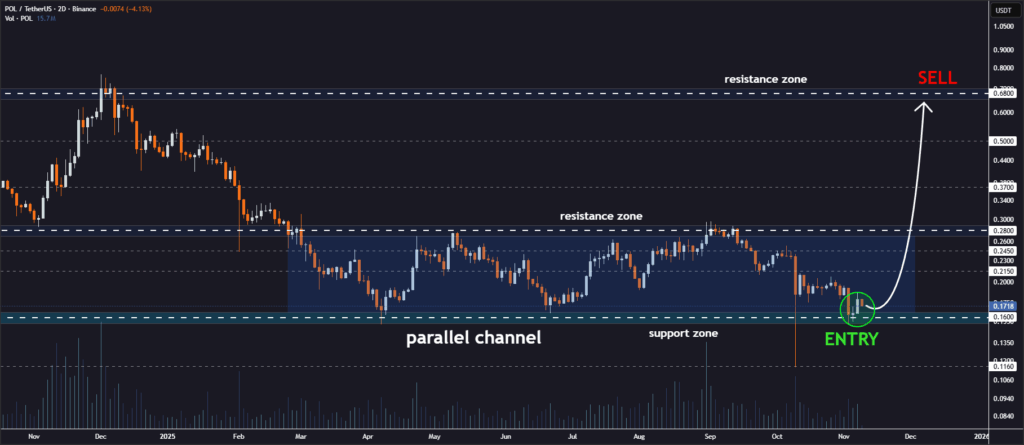
According to crypto analyst @JohncyCrypto, Polygon has established strong support at the lower boundary of its 2-day parallel channel. Following a period of downturns, market behavior seems to settle around this technical level. It seems to point to a possible turnaround. Traders are watching keenly to see if the market bounces back from this level. It could signal the start of a recovery phase.
The POL chart shows a clear Parallel Channel with defined support around $0.16 and resistance around $0.28. Currently, the price rests very close to its support level. This shows a possible entry point with little risk for buyers. The initial resistance point around $0.28 stands as the first level for traders who want to ride a possible bounce.
 Source: @JohncyCrypto
Recent developments are indicating a slight reversal in progress due to the purchase made near the supporting level. A breakthrough above $0.28 may unleash a stronger buying trend for POL to move toward higher resistance zones of $0.37, $0.50, and finally $0.68. The parallel channel pattern offers specific zones for strategic investments with both short-term prospects and long-term high-reward opportunities for investors interested in momentum.
Polygon Technical Indicators Signal Bearish Momentum
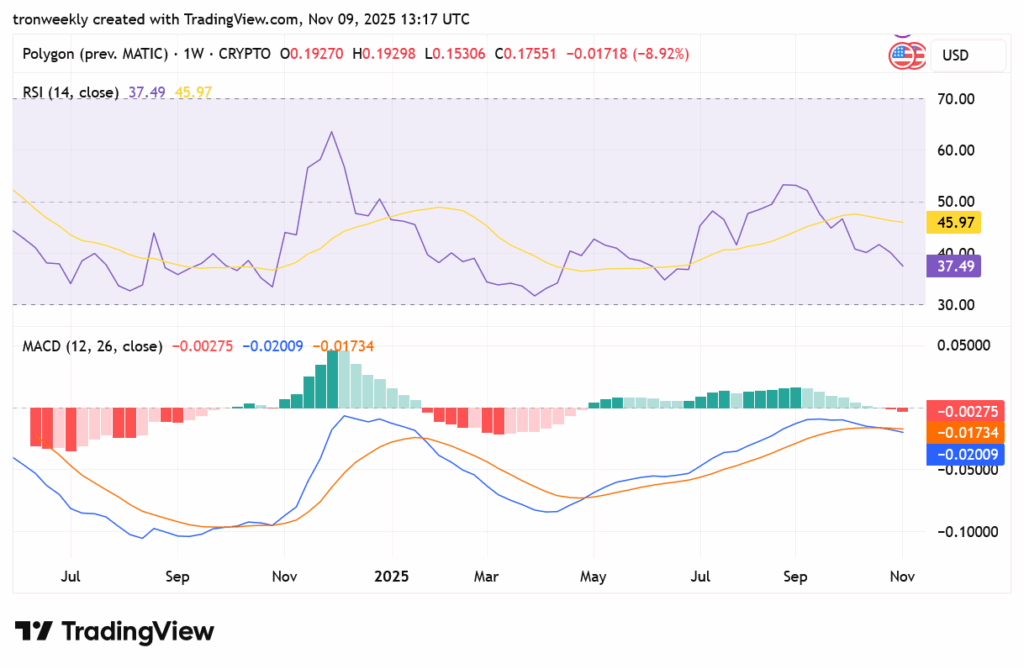
The Weekly RSI value stands at 37.49. It’s below the middle line of 50. It shows a weak buying trend. Although there are dominant sellers in the market, the RSI indicator is nearing oversold zones set at 30.
 Source: TradingView
The MACD confirms the bearish sentiment. In the MACD indicator, the MACD line remains below the signal line, and both are below zero. In the histogram chart, there are red bars indicating less buying momentum. Although there are no signs of a trend reversal yet, there are indications to focus on.
Also Read: Polygon Empowers Users to Spend Stablecoins Instantly Across 150M+ Merchants
You May Also Like

Top 3 Cryptos That Could Turn $100 Into $5,000 in 2025 – Including This Meme-to-Earn Token’s Game-Changing Potential

Sierra Leone's MoCTI partners with Sign to develop blockchain-based digital identity and stablecoin payment infrastructure.
