Ethereum (ETH) Price: Multiple Analysts Converge on Bearish Target Below $2,000
Key Takeaways
- Ethereum currently trades slightly above the $2,000 threshold following a recent decline from higher levels.
- Multiple technical analysts identify significant resistance points with downside projections toward $1,900 and below.
- One analyst’s 4-hour timeframe analysis projects a potential drop to $1,387 if critical support at $1,755 fails.
- Daily trading activity surged 150% to approach $19 billion as market participants defend the psychological $2,000 mark.
- On-chain MVRV analysis indicates a potential cycle bottom could materialize near the $1,800 price zone.
Ethereum finds itself under mounting pressure as multiple analytical approaches converge on a bearish outlook. Technical patterns, blockchain metrics, and broader market dynamics all suggest continued downside risk.
 Ethereum (ETH) Price
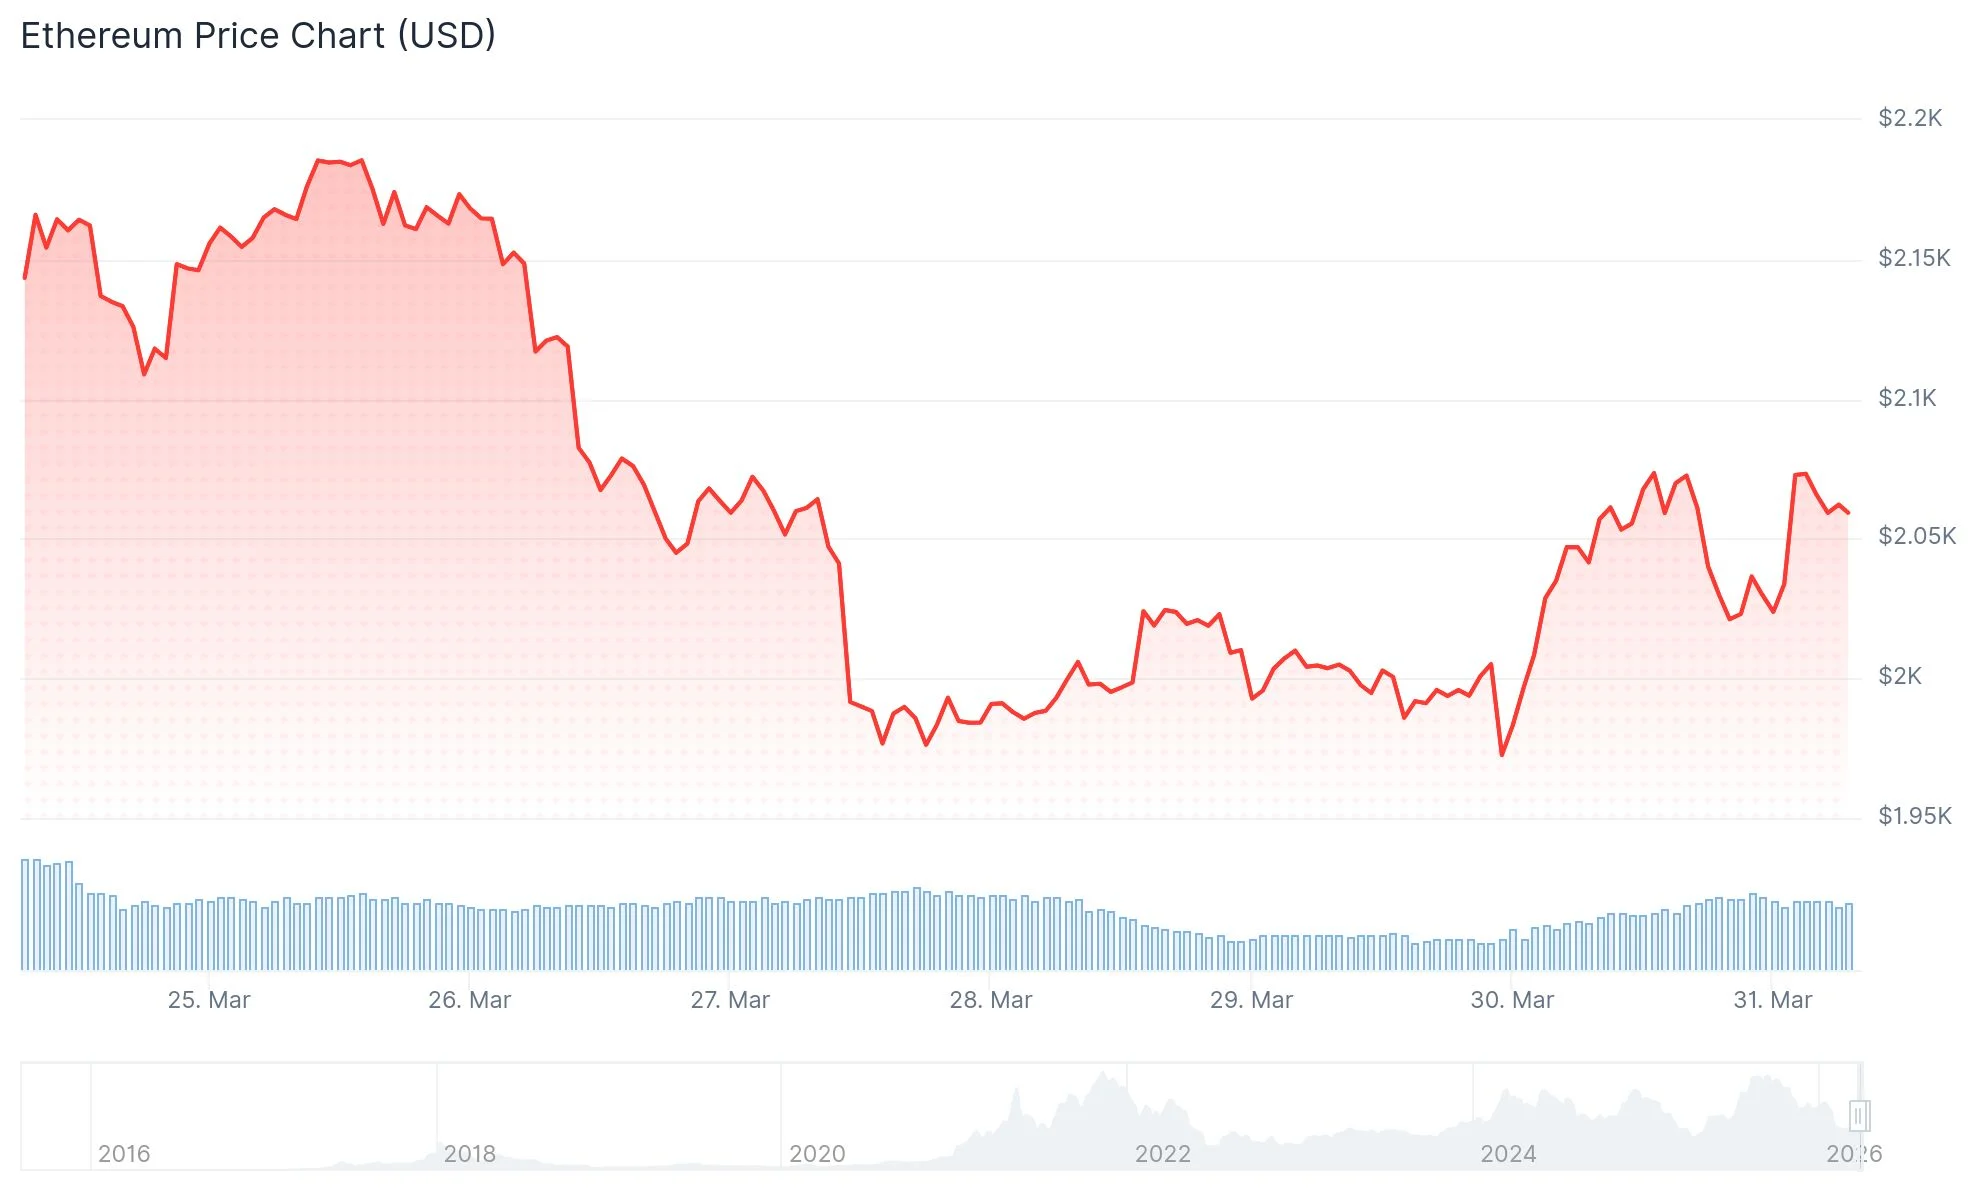
The second-largest cryptocurrency by market capitalization currently holds marginally above the $2,000 mark. Sunday’s session saw a brief breach below this psychological level before demand materialized. However, the subsequent rebound lacked conviction. After reaching an intraday peak of $2,085, ETH retraced to approximately $2,036, with market sentiment remaining firmly bearish.
Trading activity exploded by 150% over a 24-hour period, pushing volume to nearly $19 billion—representing about 9% of Ethereum’s circulating supply value. While elevated volume during rebounds can signal authentic buying conviction, the current spike hasn’t translated into a meaningful trend reversal.
Broader market dynamics compound ETH’s challenges. Crude oil prices have surged past the $100 per barrel threshold amid escalating tensions involving Iran. This development creates headwinds for risk-sensitive assets across all markets, with cryptocurrencies particularly vulnerable. Additionally, this inflationary pressure may compel the U.S. Federal Reserve to postpone anticipated interest rate reductions, further dampening appetite for speculative holdings.
Technical Analysis Points to Further Downside
Market analyst Elja presented a 12-hour timeframe chart revealing a recurring pattern of failed recoveries. Ethereum has attempted multiple bounces, yet each rally has stalled beneath the prevailing downtrend line. His projection illustrates a potential climb toward the $2,200–$2,300 range, followed by rejection at resistance and subsequent decline below $2,000 toward the $1,900 level.
Another market observer, Man of Bitcoin, provided a 4-hour chart with an even more pessimistic forecast. His technical framework highlights a pronounced descending trendline functioning as overhead resistance. Should Ethereum breach the $1,755 support zone, his analysis projects a trajectory toward $1,387. Elliott Wave annotations on his chart indicate the market remains within a downward corrective phase rather than having completed a bullish reversal structure.
Analyst Ted Pillows noted on X that Ethereum has surrendered its RSI uptrend, commenting: “Price will be next.” The Relative Strength Index has already fallen beneath its 14-period moving average. It momentarily dropped under the 40 threshold—a technical level that analysts interpret as confirmation of seller dominance.
Blockchain Metrics Suggest $1,800 as Critical Zone
One particular on-chain indicator has captured analyst attention: the 365-day Market Value to Realized Value (MVRV) Ratio. When this metric falls into negative territory, it signals that a majority of holders are underwater on their positions. A comparable pattern emerged in April 2025, immediately preceding a substantial ETH rally.
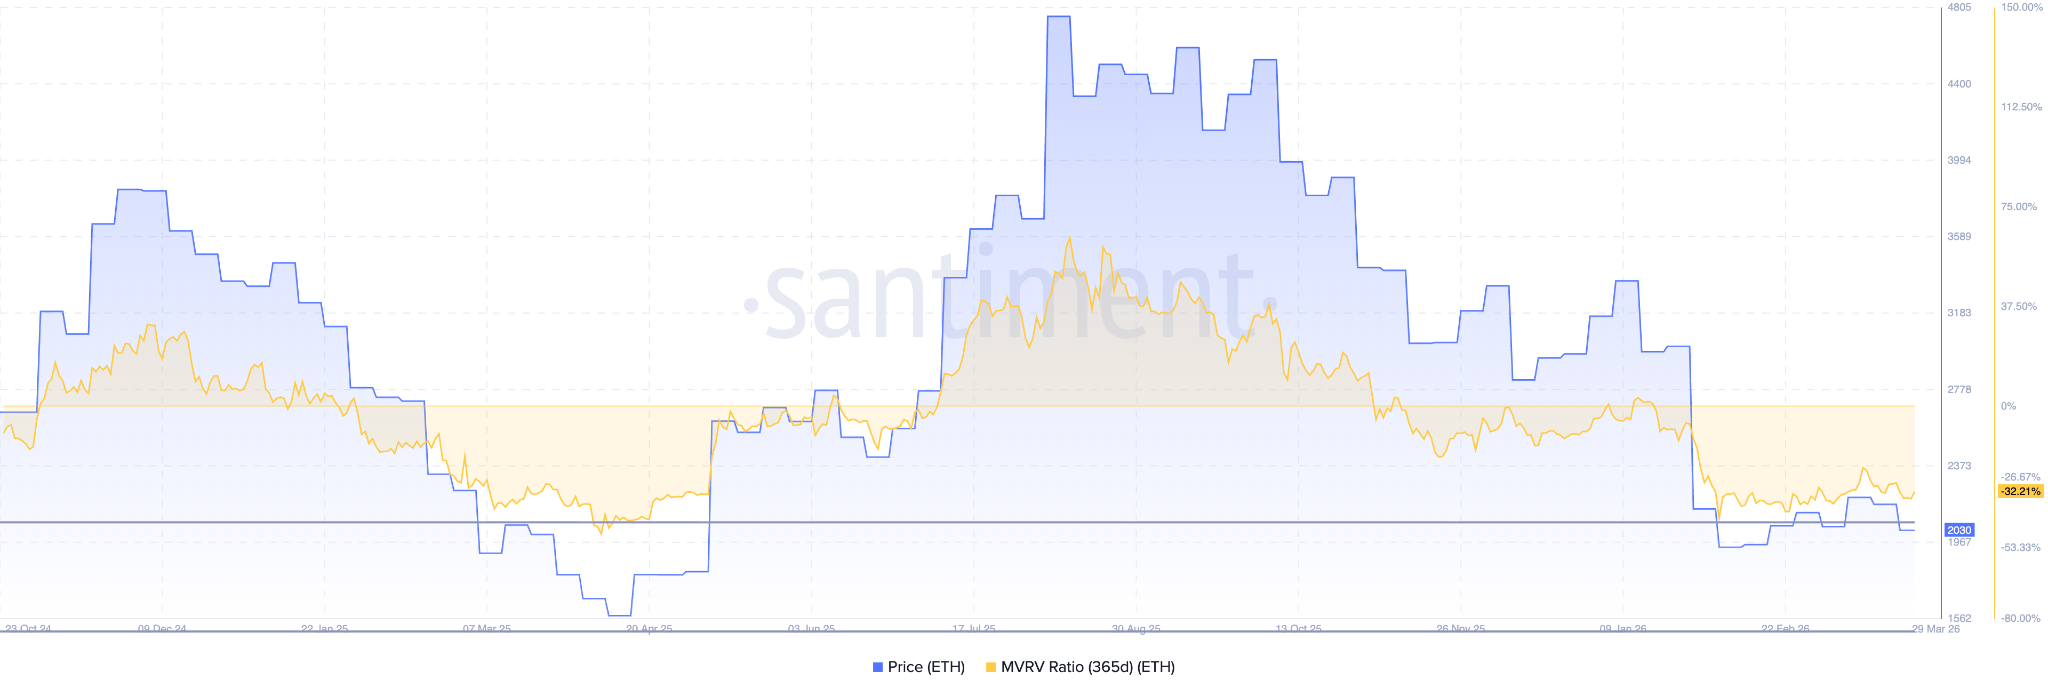 Source; Santiment
Current readings lead several analysts to identify $1,800 as the most probable bottom for this market cycle. While a brief rally toward $2,150 remains within the realm of possibility, the overall technical structure continues to favor additional downside. The only development that would invalidate the bearish thesis is a decisive break and hold above $2,150, which could potentially trigger forced short covering and ignite a momentum shift.
As of this writing, Ethereum maintains its position just above the $2,000 level, though sellers retain control of price action with the next critical support zone established at $1,800.
The post Ethereum (ETH) Price: Multiple Analysts Converge on Bearish Target Below $2,000 appeared first on Blockonomi.
You May Also Like

Ripple Moves Closer to Bank Approval as US Banking Rule Starts April 1

Official USA Token: Born in the U.S.A. (U.S.A.) Is a Fully Decentralized Solana Token With 348 Million Supply