The Iran war has now crossed the one-month mark, and markets seem to be waking up to a reality check.
To understand where things might head next into Q2, it helps to look at where markets currently stand. From a technical standpoint, the past month has been pure volatility, driven by a few key moves: oil prices have surged over 50%, U.S. Treasury yields are up around 13%, while gold has dropped nearly 15%.
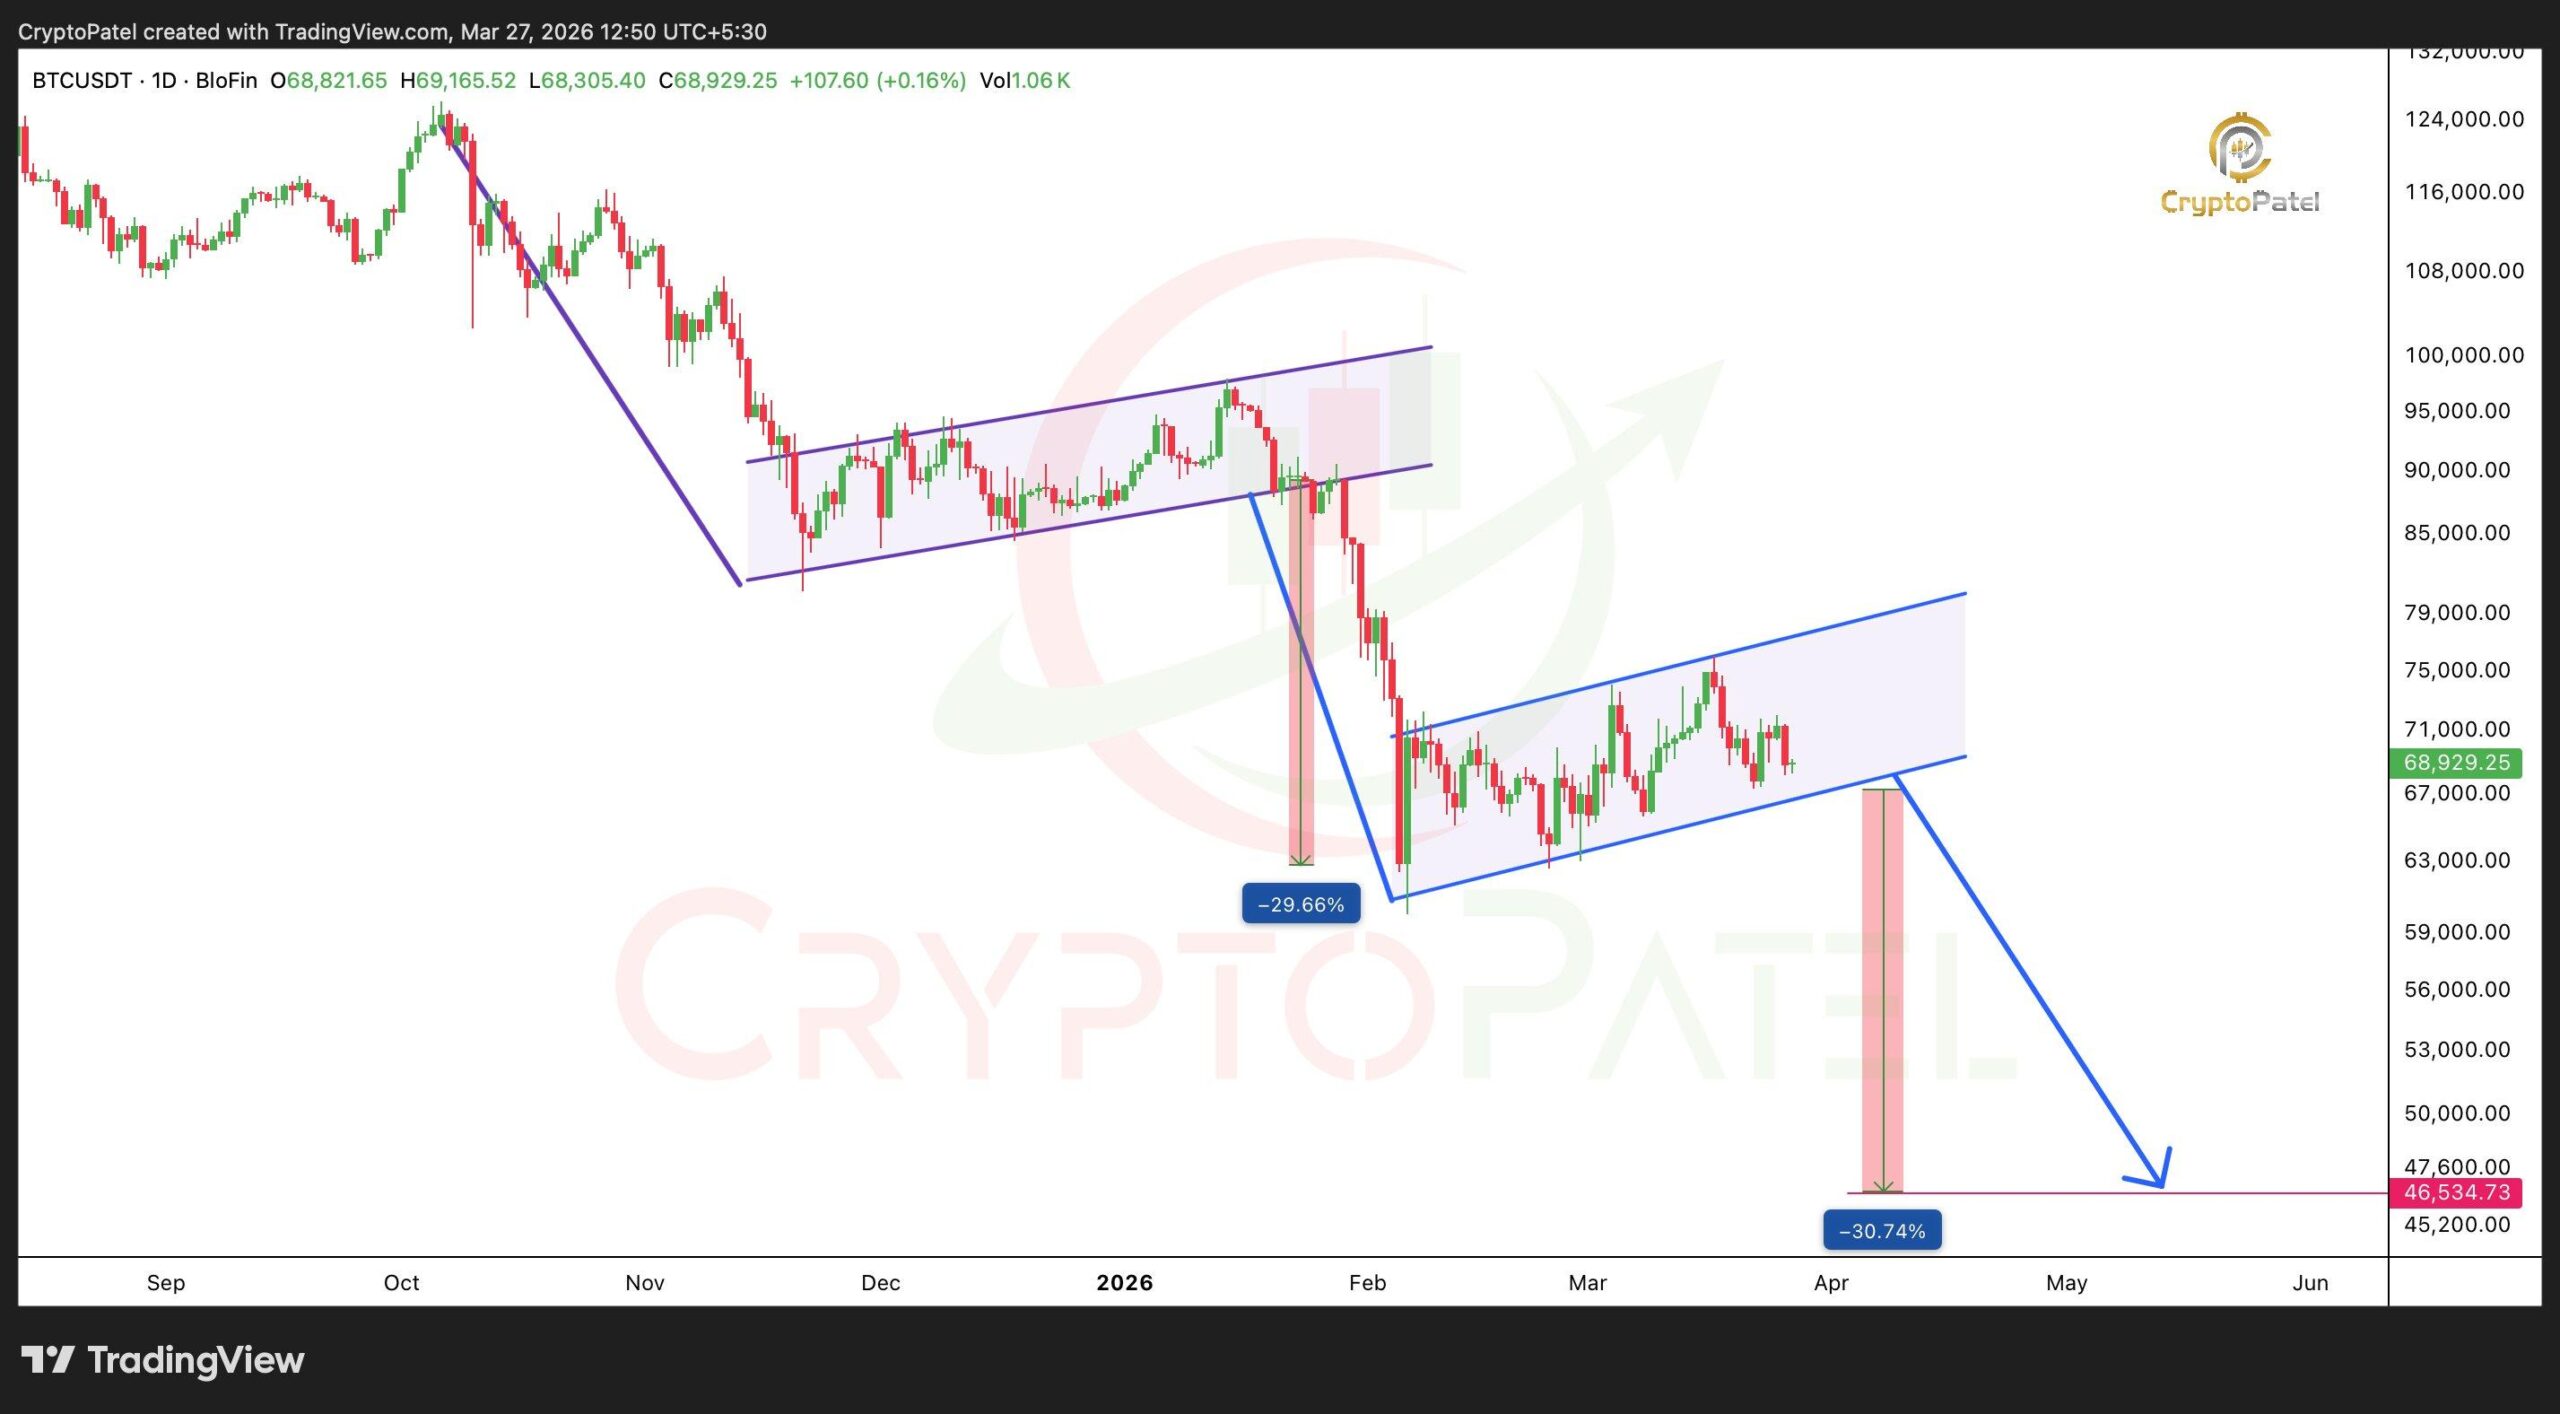
Against this backdrop, the crypto market’s 0.5% correction looks relatively muted, suggesting risk assets have held up well so far. But is that resilience now starting to get tested? Looking at the chart below, that scenario doesn’t seem too unlikely.
Source: CME FedWatch ToolAccording to The Kobeissi Letter, the Federal Reserve is no longer pricing in rate cuts until December 2027. Instead, expectations have shifted toward a 51% probability of a rate hike by March 2027, a sharp sentiment flip in just four weeks, reflecting how quickly macro conditions have changed.
Naturally, the question becomes, what’s driving this shift? As the founder of The Kobeissi Letter noted, with oil and gas prices surging, their models suggest U.S. CPI inflation could climb toward 3.5%, roughly 150 basis points above the Fed’s long-run target.
In that scenario, the argument shifts toward tighter monetary policy, meaning the Fed would lean more toward rate hikes than cuts. For crypto assets, which have so far behaved like an inflation hedge, this raises a key question: Can they continue to hold that narrative as markets rapidly reprice interest rate expectations?
Q2 begins with crypto markets facing a reality check
Compared to Q1’s average 45% ROI, Bitcoin’s [BTC] Q2 return comes in closer to 28%.
Historically, crypto markets have tended to slow down in Q2 following stronger Q1 performance. However, the 2025 cycle broke this pattern, with BTC posting roughly 30% gains in Q2 after a -12% correction in Q1, marking the first such reversal since the 2020 market cycle.
Naturally, the question now becomes: With BTC already correcting nearly 25% in Q1, could markets be setting up for a similar 2025-style move? Notably, this is where shifting interest rate expectations begin to matter. Sentiment clearly shows investors repricing risk, with the Crypto Fear & Greed Index dropping 10 points in under a week and now sitting just three points away from “extreme” fear territory.
Source: CryptoQuantMeanwhile, the impact is beginning to show on-chain as well.
As the chart above highlights, around 21,700 BTC from short-term holders flowed onto exchanges over the past 24 hours, all sold at a loss, pointing to increasing panic-driven selling pressure. Paired with a weak institutional bid, this suggests the current crypto correction is more than just a routine pullback.
Instead, capital appears to be rotating defensively, with smart money reducing exposure as fear returns to the market, particularly as the probability of rate hikes continues to rise, a backdrop that has historically weighed on crypto performance.
In that context, a 2025-style Q2 rally looks increasingly unlikely, as the current move feels less like a healthy reset and more like the early transition into a broader bear phase.
Final Summary
- Inflation is pushing markets to reprice rate hikes, challenging crypto’s inflation-hedge narrative.
- Panic selling, falling market sentiment, and weak institutional demand suggest the current correction may be shifting from a reset toward an early bear market.
Source: https://ambcrypto.com/bitcoin-down-25-in-q1-is-cryptos-correction-turning-bearish/