Dogecoin has been doing something interesting. It is holding onto a key level that could be setting the stage for the next big move. After the kind of rallies thatDogecoin has been doing something interesting. It is holding onto a key level that could be setting the stage for the next big move. After the kind of rallies that

Dogecoin (DOGE) Shows the Same Pattern That Triggered Its Last 600% Rally

2026/03/20 08:00
4 min read
For feedback or concerns regarding this content, please contact us at crypto.news@mexc.com

Dogecoin has been doing something interesting. It is holding onto a key level that could be setting the stage for the next big move. After the kind of rallies that turned ordinary memecoin traders into millionaires in previous cycles, DOGE has spent the last several months just consolidating and catching its breath.

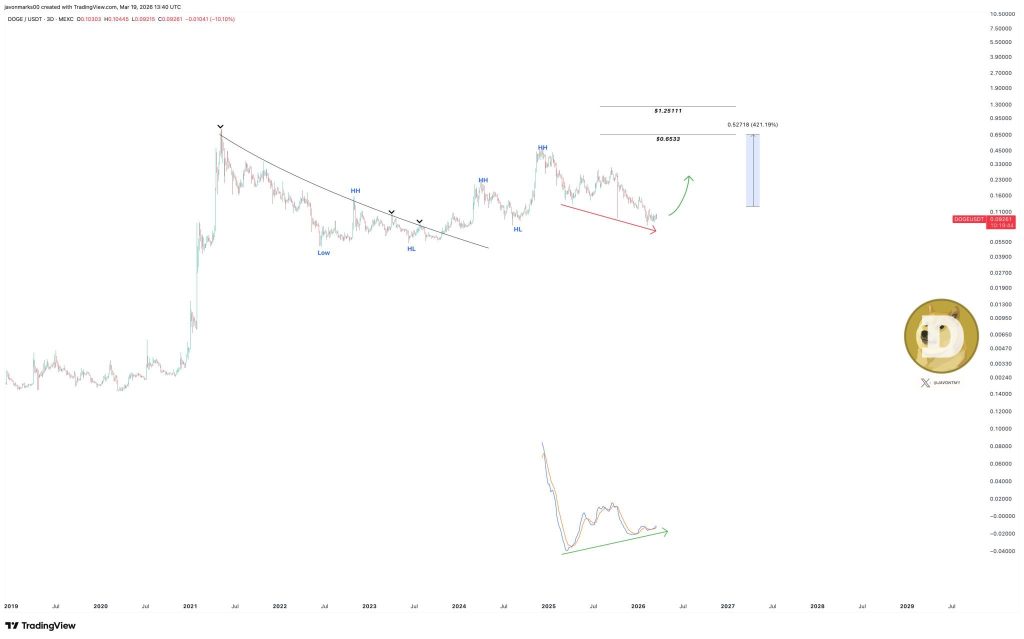
Javon Marks shared the setup on X, noting that Dogecoin continues to maintain a key breakout with the target at $0.6533. The chart also shows a regular bullish divergence with the MACD, a signal that often precedes trend reversals. 

This divergence could point toward a continuation of a breakout run of over 581% breakout run to reach that target. Above $0.6533, the next level at $1.25111 comes into play.

What the DOGE Chart is Showing

The chart shared by Javon shows the DOGE price breaking above a long-term resistance level that had capped price action for months. Since that breakout, the DOGE price has held above the level, suggesting that the move has genuine support rather than being a false start.

Source: X/@JavonTm1

Holding a breakout is often more significant than the breakout itself. Many assets spike above resistance only to fall back within days. The DOGE price maintaining its position above this level tells traders that buyers are willing to step in at higher prices, a sign of genuine demand.

The current DOGE price is trading near $0.094 and remains well below the $0.6533 target, but the structure indicates that the path higher could unfold over time if the breakout holds.

Read Also: How Japan’s Rate Hikes Make XRP and Ripple’s ODL Essential

The MACD Bullish Divergence

The regular bullish divergence on the MACD adds weight to the bullish case. This pattern occurs when price makes a lower low while the MACD makes a higher low, indicating that downward momentum is weakening even as price tests new lows. It often precedes trend reversals.

Javon sees this divergence as a sign that the breakout run still has legs. In technical analysis, divergences are generally considered leading indicators, esentially early warning signals that the current trend might be running out of steam and a reversal could be around the corner.

For DOGE specifically, this divergence indicates that the selling pressure behind the recent pullback may have largely played itself out. In other words, the sellers could be getting tired, and buyers might just be waiting in the wings ready to step in.

The DOGE Path to $0.6533 and Beyond

Javon’s target of $0.6533 represents significant upside from current levels near $0.094. Achieving that target would require a move of nearly 600%, which aligns with the magnitude of previous Dogecoin rallies. While ambitious, it is not unprecedented for an asset with Dogecoin’s volatility and history.

Above $0.6533, the next target sits at $1.25111, more than 13 times current prices. These levels are not arbitrary. They represent previous areas of resistance and potential liquidity zones where price could react.

The path would not be straight. The DOGE price would need to clear multiple resistance levels along the way, including the $0.15 to $0.20 zone, the $0.30 to $0.35 area, and the $0.50 level before reaching the primary target. Each of these could attract sellers and require consolidation before the next leg higher.

Read Also: How Much Will 12,457 $XLM Be Worth By 2027? Stellar Price Prediction

What Comes Next for the DOGE Price

The DOGE price now sits at a critical juncture. The breakout is holding. The MACD shows bullish divergence. The targets are defined. What remains is confirmation through continued strength and volume.

If DOGE can push and stay above recent highs, that would be the first real sign that momentum is starting to build. Breaking above $0.12 would be a clear signal that buyers are coming back to the table. And if it makes a move toward $0.15, that’s when the longer-term target of $0.6533 starts to come into focus.

On the downside though, DOGE needs to hold above the breakout level to keep the bullish case alive. If it slips back below that level, it would suggest the breakout was a false alarm and that the price probably needs more time consolidating before it can take another serious run at it.

Javon has identified the setup. The breakout is holding. The divergence is flashing. The targets are clear. For traders who study patterns, this is the kind of setup worth watching. Whether the DOGE price reaches $0.6533 and beyond depends on whether the momentum continues building.

Subscribe to our YouTube channel for daily crypto updates, market insights, and expert analysis.

The post Dogecoin (DOGE) Shows the Same Pattern That Triggered Its Last 600% Rally appeared first on CaptainAltcoin.

Market Opportunity
DOGE Logo
DOGE Price(DOGE)
$0.09413
$0.09413$0.09413
+1.35%
USD
DOGE (DOGE) Live Price Chart
Disclaimer: The articles reposted on this site are sourced from public platforms and are provided for informational purposes only. They do not necessarily reflect the views of MEXC. All rights remain with the original authors. If you believe any content infringes on third-party rights, please contact crypto.news@mexc.com for removal. MEXC makes no guarantees regarding the accuracy, completeness, or timeliness of the content and is not responsible for any actions taken based on the information provided. The content does not constitute financial, legal, or other professional advice, nor should it be considered a recommendation or endorsement by MEXC.

You May Also Like

BFX Presale Raises $7.5M as Solana Holds $243 and Avalanche Eyes $1B Treasury — Best Cryptos to Buy in 2025

BFX Presale Raises $7.5M as Solana Holds $243 and Avalanche Eyes $1B Treasury — Best Cryptos to Buy in 2025

BFX presale hits $7.5M with tokens at $0.024 and 30% bonus code BLOCK30, while Solana holds $243 and Avalanche builds a $1B treasury to attract institutions.
Share
Blockchainreporter2025/09/18 01:07
World Gold Council plans to build shared infrastructure platform for digital gold

World Gold Council plans to build shared infrastructure platform for digital gold

The post World Gold Council plans to build shared infrastructure platform for digital gold appeared on BitcoinEthereumNews.com. The World Gold Council (WGC), a
Share
BitcoinEthereumNews2026/03/20 14:45
Ethereum koers toont zeldzaam dubbel koopsignaal en richt zich op $4.550

Ethereum koers toont zeldzaam dubbel koopsignaal en richt zich op $4.550

Connect met Like-minded Crypto Enthusiasts! Connect op Discord! Check onze Discord   Ethereum laat op de uurgrafiek twee opeenvolgende TD Sequential koopsignalen zien. Deze indicator meet uitputting in een trend en geeft vaak een signaal dat de verkoopdruk kan afnemen. Dit dubbele signaal verschijnt rond het niveau van $4.516, waar de ETH prijs kortstondig steun vindt. Dit type formatie komt zelden voor en wordt daarom extra nauwlettend gevolgd. Wat gaat de Ethereum koers hiermee doen? Ethereum koers test steun rond $4.516 De scherpe daling van de Ethereum koers vanaf de prijszone rond $4.800 bracht de ETH prijs in korte tijd naar ongeveer $4.516. Op dit niveau trad duidelijke koopactiviteit op, waardoor de neerwaartse beweging tijdelijk werd gestopt. Het dubbele signaal dat door de TD Sequential indicator is gegenereerd, viel precies samen met dit prijspunt. De TD Sequential is opgebouwd uit negen candles die een trend meetellen. Wanneer de negende candle verschijnt, kan dit duiden op een trendomslag. In dit geval verschenen zelfs twee signalen kort na elkaar, wat aangeeft dat de verkoopdruk mogelijk uitgeput is. Het feit dat dit gebeurde in een zone waar ETH kopers actief bleven, maakt het patroon extra opvallend. TD Sequential just flashed two buy signals for Ethereum $ETH! pic.twitter.com/JPO8EhiEPi — Ali (@ali_charts) September 16, 2025 Welke crypto nu kopen?Lees onze uitgebreide gids en leer welke crypto nu kopen verstandig kan zijn! Welke crypto nu kopen? Fed-voorzitter Jerome Powell heeft aangekondigd dat de rentes binnenkort zomaar eens omlaag zouden kunnen gaan, en tegelijkertijd blijft BlackRock volop crypto kopen, en dus lijkt de markt klaar om te gaan stijgen. Eén vraag komt telkens terug: welke crypto moet je nu kopen? In dit artikel bespreken we de munten die… Continue reading Ethereum koers toont zeldzaam dubbel koopsignaal en richt zich op $4.550 document.addEventListener('DOMContentLoaded', function() { var screenWidth = window.innerWidth; var excerpts = document.querySelectorAll('.lees-ook-description'); excerpts.forEach(function(description) { var excerpt = description.getAttribute('data-description'); var wordLimit = screenWidth wordLimit) { var trimmedDescription = excerpt.split(' ').slice(0, wordLimit).join(' ') + '...'; description.textContent = trimmedDescription; } }); }); Technische indicatoren schetsen herstelkans voor ETH Naast de dubbele koopsignalen verstrekken ook andere indicatoren belangrijke aanwijzingen. Tijdens de daling van de ETH koers waren grote rode candles zichtbaar, maar na de test van $4.516 stabiliseerde de Ethereum koers. Dit wijst op een mogelijke verschuiving in het evenwicht tussen de bears en bulls. Als deze opwaartse beweging doorzet, liggen de eerste weerstanden rond $4.550. Daarboven wacht een sterkere zone rond $4.650. Deze niveaus zijn in eerdere Ethereum sessies al meerdere keren getest. Een doorbraak zou ruimte openen richting de all-time high van ETH rond $4.953. Wanneer de prijs toch opnieuw onder $4.516 zakt, liggen er zones rond $4.500 en $4.450 waar grotere kooporders worden verwacht. Deze niveaus kunnen als een vangnet fungeren, mocht de druk opnieuw toenemen. Marktdynamiek bevestigt technische indicatoren De huidige situatie volgt op een bredere correctie in de cryptomarkt. Verschillende vooraanstaande crypto tokens zagen scherpe koersdalingen, waarna traders op zoek gingen naar signalen voor een mogelijke ommekeer. Dat juist Ethereum nu een dubbel TD Sequential signaal toont, versterkt de interesse in dit scenario. Fundamenteel blijft Ethereum sterk. Het aantal ETH tokens dat via staking is vastgezet, blijft groeien. Dat verkleint de vrije circulatie en vermindert verkoopdruk. Tegelijk blijft het netwerk intensief gebruikt voor DeFi, NFT’s en stablecoins. Deze activiteiten zorgen voor een stabiele vraag naar ETH, ook wanneer de prijs tijdelijk onder druk staat. Fundamentele drijfveren achter de Ethereum koers De Ethereum koers wordt echter niet alleen bepaald door candles en patronen, maar ook door bredere factoren. Een stijgend percentage van de totale ETH supply staat vast in staking contracten. Hierdoor neemt de liquiditeit op exchanges af. Dit kan prijsschommelingen versterken wanneer er plotseling meer koopdruk ontstaat. Daarnaast is Ethereum nog steeds het grootste smart contract platform. Nieuwe standaarden zoals ERC-8004 en ontwikkelingen rond layer-2 oplossingen houden de activiteit hoog. Deze technologische vooruitgang kan de waardepropositie ondersteunen en zo indirect bijdragen aan een ETH prijsherstel. Het belang van de korte termijn dynamiek De komende handelsdagen zullen duidelijk maken of de bulls genoeg kracht hebben om door de weerstandszone rond $4.550 te breken. Voor de bears ligt de focus juist op het verdedigen van de prijsregio rond $4.516. De whales, die met grote handelsorders opereren, kunnen hierin een beslissende rol spelen. Het dubbele TD Sequential signaal blijft hoe dan ook een zeldzame gebeurtenis. Voor cryptoanalisten vormt het een objectief aanknopingspunt om de kracht van de huidige Ethereum trend te toetsen. Vooruitblik op de ETH koers Ethereum liet twee opeenvolgende TD Sequential signalen zien op de uurgrafiek, iets wat zelden voorkomt. Deze formatie viel samen met steun rond $4.516, waar de bulls actief werden. Als de Ethereum koers boven dit niveau blijft, kan er ruimte ontstaan richting $4.550 en mogelijk $4.650. Zakt de prijs toch opnieuw onder $4.516, dan komen $4.500 en $4.450 in beeld als nieuwe steunzones. De combinatie van zeldzame indicatoren en een sterke fundamentele basis maakt Ethereum interessant voor zowel technische als fundamentele analyses. Of de bulls het momentum echt kunnen overnemen, zal blijken zodra de Ethereum koers de eerstvolgende weerstanden opnieuw test. Koop je crypto via Best Wallet Best wallet is een topklasse crypto wallet waarmee je anoniem crypto kan kopen. Met meer dan 60 chains gesupport kan je al je main crypto coins aanschaffen via Best Wallet. Best wallet - betrouwbare en anonieme wallet Best wallet - betrouwbare en anonieme wallet Meer dan 60 chains beschikbaar voor alle crypto Vroege toegang tot nieuwe projecten Hoge staking belongingen Lage transactiekosten Best wallet review Koop nu via Best Wallet Let op: cryptocurrency is een zeer volatiele en ongereguleerde investering. Doe je eigen onderzoek. Het bericht Ethereum koers toont zeldzaam dubbel koopsignaal en richt zich op $4.550 is geschreven door Dirk van Haaster en verscheen als eerst op Bitcoinmagazine.nl.
Share
Coinstats2025/09/17 23:31