

Ethereum price: ETH sits at a decision point around $2,030

The broader crypto market is trying to stabilize after recent volatility, and the price ethereum against USDT now trades near a key technical area that could shape the next swing.
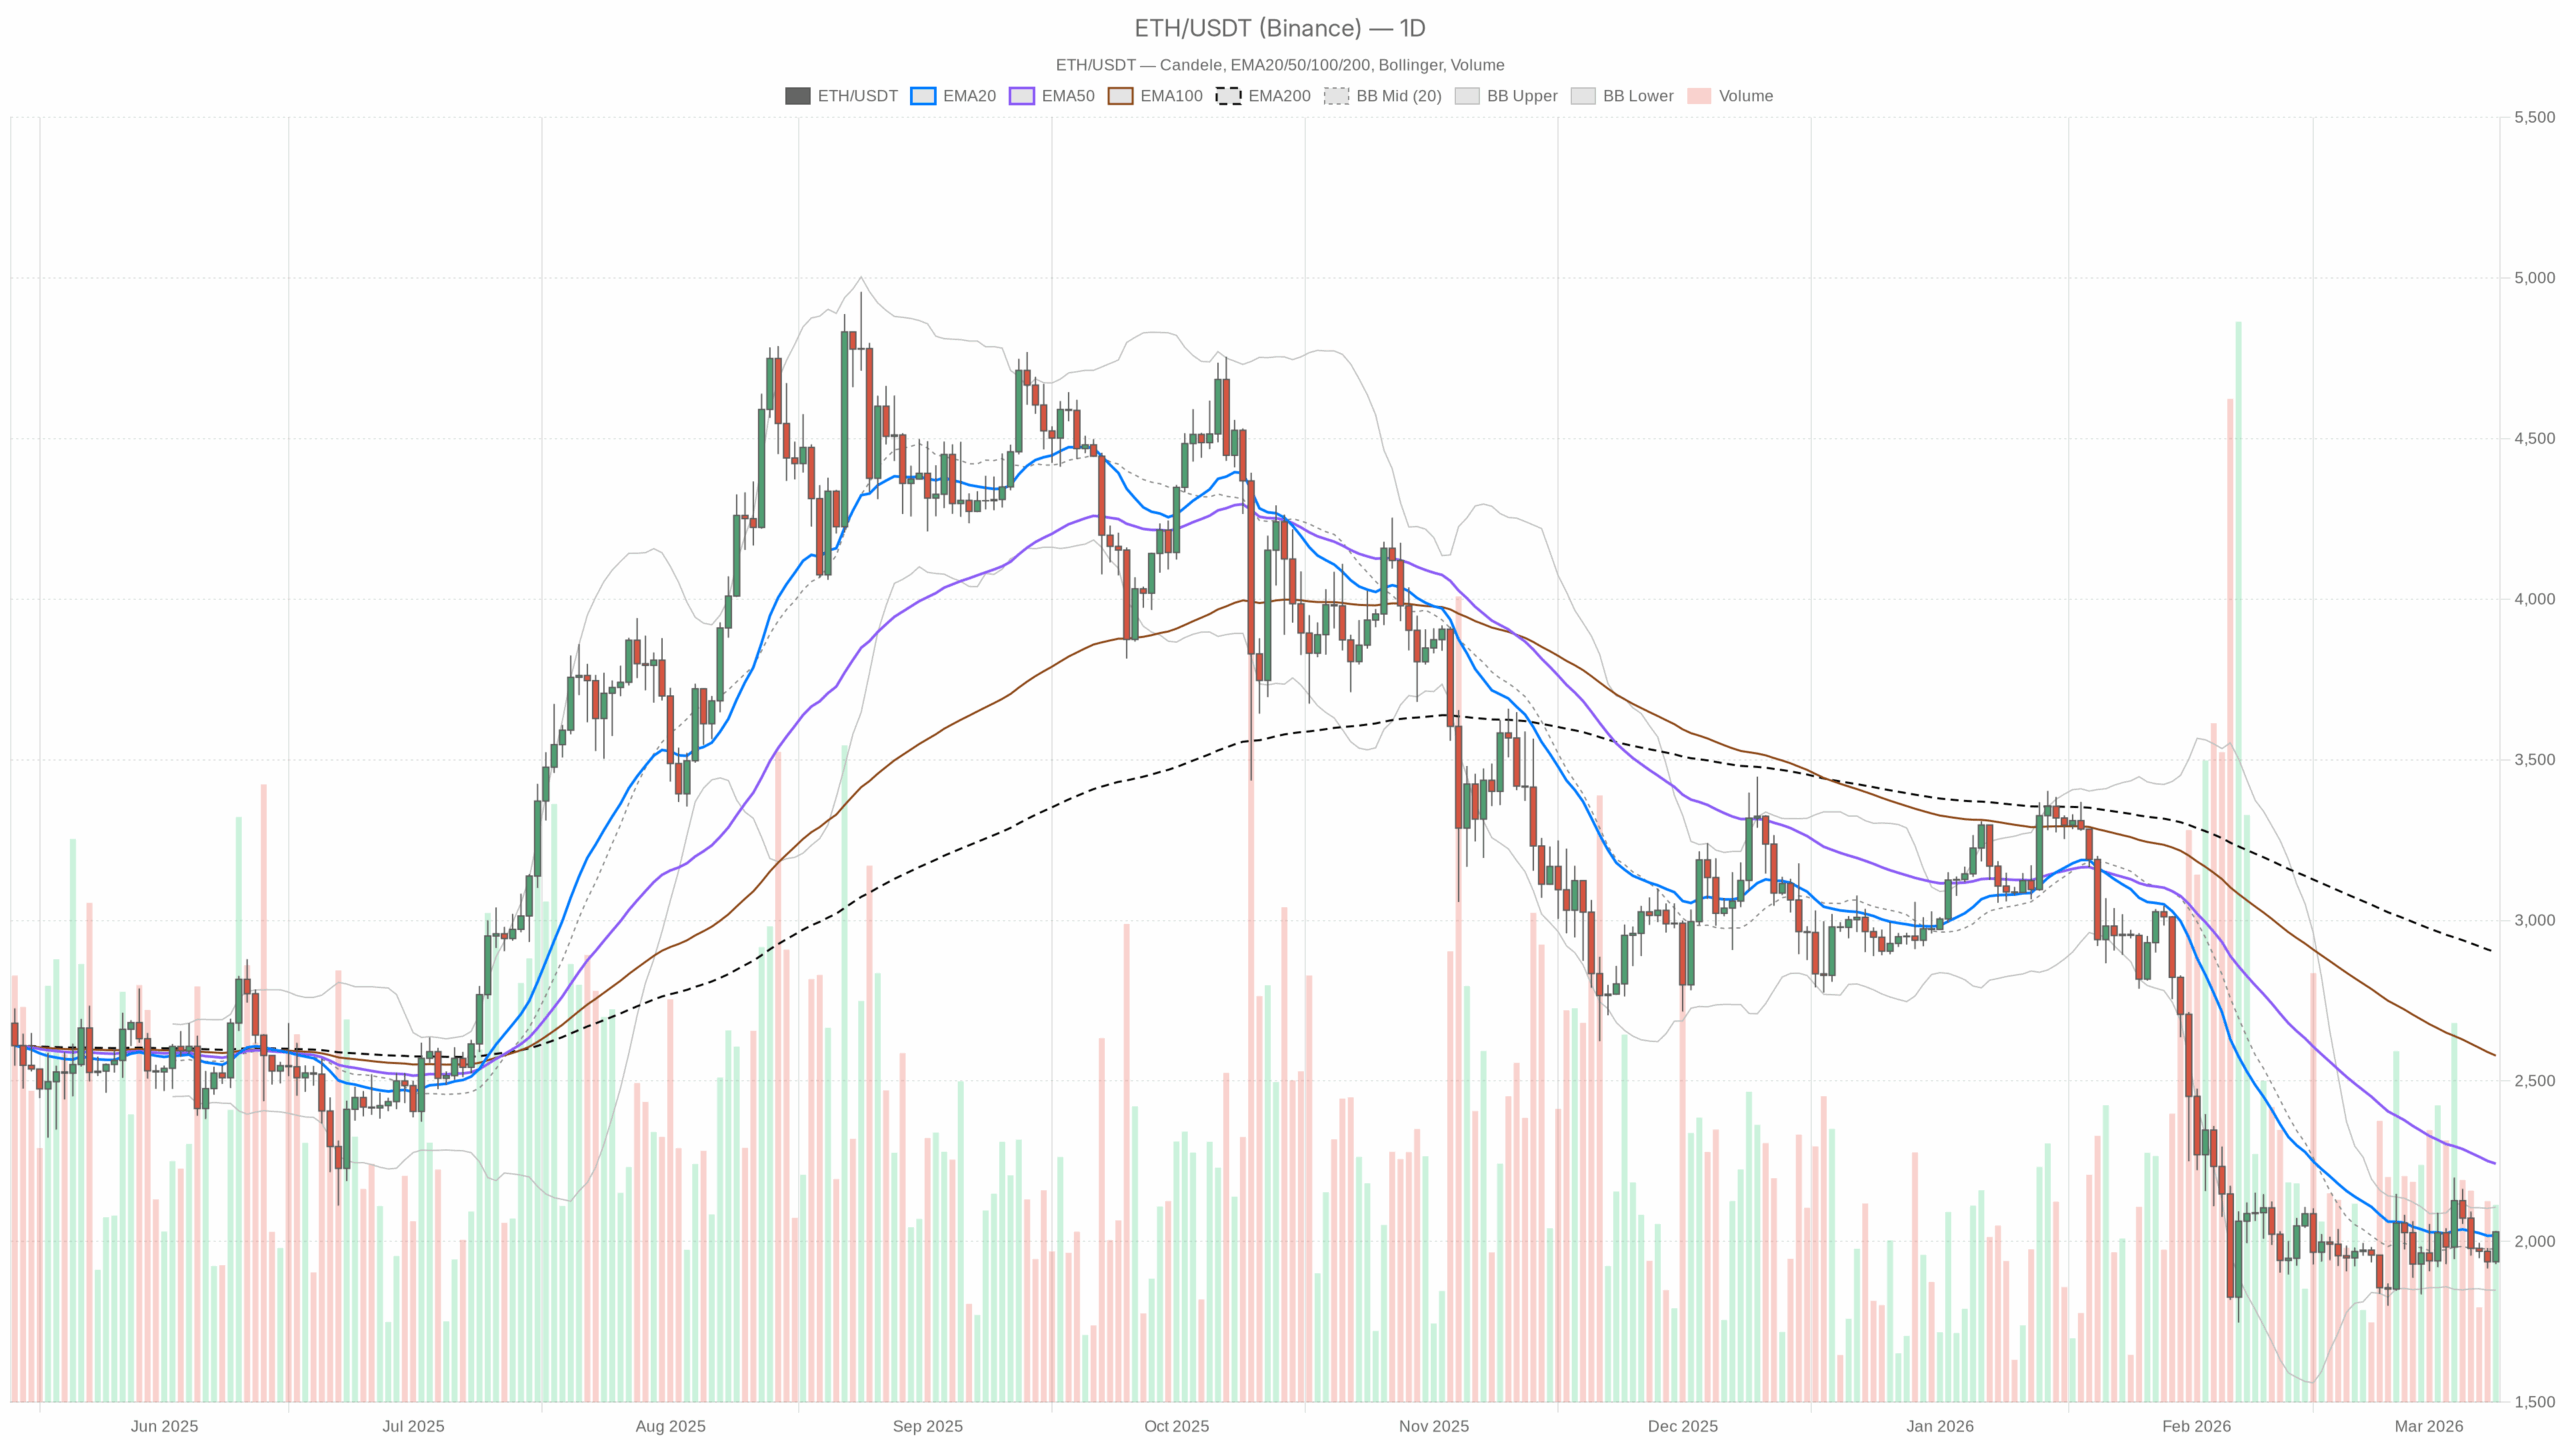 ETH/USDT daily chart with EMA20, EMA50 and volume”
loading=”lazy” />ETH/USDT — daily chart with candlesticks, EMA20/EMA50 and volume.
Ethereum Price (ETHUSDT): Daily Chart Sets a Cautious Bullish Tilt
The price of Ethereum against USDT is trading around $2,030, and the market is acting like it wants to turn the corner, but has not fully committed yet. The broader crypto market cap is up about 3% in the last 24 hours, but sentiment is still locked in Extreme Fear. That cocktail, with price stabilizing while emotions remain depressed, often marks the early stages of a recovery rather than the end of one.
On the daily timeframe, ETH is trying to build a base just above its short-term averages, while still buried under the longer-term trend. In other words: tactically constructive, structurally damaged. The dominant force right now is short-covering and mean reversion after a big drawdown, not yet a full-blown bullish trend.
Given the data, the main scenario on D1 is cautiously bullish and mean-reversion up, but any upside is still operating inside a larger downtrend defined by the 50-day and 200-day EMAs.
Daily Structure (D1): Why the Bias Leans Cautiously Bullish
Trend & EMAs (D1)
– Price: $2,030.12
– EMA 20: $2,018.94
– EMA 50: $2,242.23
– EMA 200: $2,900.51
ETH is trading just above its 20-day EMA but still well below both the 50-day and 200-day EMAs.
Human read: Short-term momentum has flipped slightly positive, with price reclaiming the 20-day, but the medium and long-term trends are still clearly down. This is the typical profile of a bear-market rally or a repair phase, not yet a confirmed new uptrend. Bulls are in control on the daily swing level, but they are fighting a bigger structural downtrend overhead.
RSI (D1)
– RSI 14: 48.2
RSI is sitting just under the midpoint, neither overbought nor oversold.
Human read: Momentum has normalized from any extreme selling, but it has not flipped decisively bullish. The market is in balance: there is room for a push higher without being stretched, but there is no built-in squeeze from oversold conditions either.
MACD (D1)
– MACD line: -55.88
– Signal line: -81.87
– Histogram: +25.99
The MACD is still negative, but the line has crossed above the signal and the histogram is positive.
Human read: Trend momentum is still in the below zero zone, confirming the larger downtrend, but the recent bullish crossover says downside pressure is easing and buyers are starting to regain initiative. This is what you typically see in the early phase of a recovery inside a broader bearish structure.
Bollinger Bands (D1)
– Mid-band (20-day basis): $1,977.91
– Upper band: $2,107.14
– Lower band: $1,848.69
– Price vs bands: ETH at $2,030.12 trades slightly above the mid-band, below the upper band.
Human read: Price has migrated from the lower half of the bands back above the midline, indicating a shift from pressure-to-sell on bounces toward a more neutral-to-bid tone. There is still upside room to the upper band near $2,100 before anything looks stretched on the daily. The move is controlled, not capitulatory or euphoric.
ATR & Volatility (D1)
– ATR 14: $139.26
Daily volatility is elevated but not extreme, with an average true range of about $140.
Human read: ETH can easily swing 6–7% in a day at current volatility. That is enough to punish late entries in either direction. Position sizing and wider stops are needed; tight intraday stops risk getting churned out.
Daily Pivot Levels (D1)
– Pivot point (PP): $1,997.54
– Resistance 1 (R1): $2,065.42
– Support 1 (S1): $1,962.23
Price is trading above the daily pivot, between PP and R1.
Human read: Holding above $1,997 keeps short-term control with buyers on the daily. Immediate resistance is clustered near $2,065. Failure to break that region would show hesitation from bulls, while a sustained push above it would confirm that this bounce still has fuel.
Hourly (H1): Momentum Favors the Upside
Trend & EMAs (H1)
– Price: $2,029.09
– EMA 20: $1,993.18
– EMA 50: $1,982.89
– EMA 200: $1,994.24
On the hourly chart, price is decisively above all three EMAs, with the shorter EMAs stacked above the longer ones.
Human read: Intraday, ETH is in a clean uptrend. Dips towards the 20 and 50 EMA zone, around $1,990–2,000, are getting bought, and the intraday structure is supportive of the D1 mean-reversion bounce.
RSI (H1)
– RSI 14: 67.82
RSI is pushing into the high side of neutral, flirting with overbought.
Human read: Buyers have been in charge over the last several hours, and the move has some heat. There is potential for a pause or shallow pullback, but it is not a blow-off yet. Chasing at this moment on low timeframes is riskier; better entries tend to come after a cool-off.
MACD (H1)
– MACD line: +16.7
– Signal line: +11.98
– Histogram: +4.72
MACD is above zero with the line above the signal.
Human read: Momentum intraday is firmly bullish. The trend has shifted from consolidation to impulse. For now, buyers are pressing the advantage, and pullbacks are being absorbed.
Bollinger Bands (H1)
– Mid-band: $1,985.42
– Upper band: $2,041.85
– Lower band: $1,929.00
– Price: $2,029.09, near but not at the upper band.
Human read: Price is riding the upper half of the bands, which is typical of a short-term uptrend. It is not yet a squeeze, but there is enough strength that selling into every uptick has been punished recently.
ATR & Pivot (H1)
– ATR 14: $24.75
– Pivot point (PP): $2,026.74
– R1: $2,034.54
– S1: $2,021.28
Hourly volatility is moderate, and price is trading just above the H1 pivot but beneath R1.
Human read: The intraday battlefield is tight, roughly $2,020–2,035. Staying above the pivot near $2,027 keeps very short-term control with the bulls. Quick $20–25 swings are normal noise here.
15-Minute (M15): Execution Context, Not a Bias Driver
Trend & EMAs (M15)
– Price: $2,030.26
– EMA 20: $2,017.85
– EMA 50: $2,002.58
– EMA 200: $1,979.81
Price is above all intraday EMAs, with a healthy bullish stack.
Human read: On a micro level, buyers remain in control. Short-term trend followers will still see this as a buy-the-dip environment as long as price holds above roughly $2,010–2,015.
RSI & MACD (M15)
– RSI 14: 62.36
– MACD line: +8.2, Signal: +8.12, Histogram: +0.09
RSI is in bullish territory, and MACD is above zero but with a nearly flat histogram.
Human read: Momentum is bullish but losing a bit of steam on this tiny timeframe. Often this leads to a sideways chop or a shallow dip before the next decision move.
Bollinger Bands & Pivot (M15)
– Mid-band: $2,017.05
– Upper band: $2,039.35
– Lower band: $1,994.75
– Pivot point (PP): $2,026.73
– R1: $2,034.54
– S1: $2,022.46
Human read: Price is hovering just above the pivot and mid-band, reflecting a controlled intraday uptrend. Very short-term traders are likely using the $2,020–2,025 area as their reference support.
Market Context: Fearful Sentiment, Constructive Price
The broader crypto market cap sits around $2.43T with a 3% daily gain, while Bitcoin dominance is high near 56.7%. At the same time, the fear and greed index prints an extreme fear value of 8.
Human read: Price behavior and sentiment are out of sync. The tape shows stabilization and early recovery dynamics in ETH, while the crowd remains highly risk-averse. Historically, that kind of disconnect often favors patient dip-buyers rather than late shorts, provided macro conditions do not deteriorate again.
DeFi fee data shows a big drop over the last month across major DEXs despite a short-term pop in some venues. That lines up with a risk-off, lower-activity environment for Ethereum-based trading, but it does not contradict the idea of a price base forming. Activity usually lags price turns.
Scenarios for Ethereum Price (ETHUSDT)
Bullish Scenario (Main on D1)
In the bullish case, ETH continues this mean-reversion phase and builds a higher low above the daily pivot.
Key elements:
- Daily structure holds above $1,997, the D1 pivot, and ideally above the 20-day EMA around $2,019.
- Intraday EMAs on H1 and M15 continue to act as dynamic support, with dips toward $2,000–2,010 getting bought.
- RSI on D1 climbs sustainably above 50 while MACD histogram stays positive or expands.
If that plays out, upside reference levels are:
- First resistance: $2,065–2,100 (D1 R1 and upper Bollinger band). A move into this zone completes the first leg of the bounce.
- Extension target: a push towards the 50-day EMA near $2,240. That is where the larger downtrend is likely to push back hardest.
What invalidates the bullish scenario?
- A decisive daily close back below $1,997 and particularly below $1,962, the D1 S1, would show that the current bounce has failed.
- On momentum, a fresh bearish crossover in D1 MACD, with the line crossing below the signal, combined with RSI rolling back under 45, would confirm that sellers have regained the upper hand.
If that happens, the current move is downgraded from early base-building to a dead-cat bounce inside a continuing downtrend.
Bearish Scenario
In the bearish case, the short-term bounce runs out of steam under resistance, and the higher timeframe downtrend reasserts itself.
Key elements:
- Price fails to break or hold above $2,065–2,100 and starts closing back below the 20-day EMA around $2,019.
- On H1 and M15, the EMAs flip, with price slicing through $2,000 and intraday pullbacks into that area turning into sell opportunities instead of support.
- D1 RSI drifts back toward the low 40s and MACD’s positive histogram shrinks toward zero or turns negative.
If that unfolds, first downside references are:
- Support near the mid-Bollinger band and pivot area around $1,980–2,000. Losing this area opens the door to a retest of the lower band region.
- Deeper extension could revisit the $1,850–1,900 range, where the lower Bollinger band currently sits and where prior demand may re-emerge.
What invalidates the bearish scenario?
- A strong daily close above $2,100 and sustained trading above that level, especially if accompanied by D1 RSI pushing above 55 and MACD trend continuing to improve, would put pressure on shorts.
- A subsequent push toward or above the 50-day EMA around $2,240 would effectively break the current bearish narrative and shift the medium-term bias toward a genuine trend reversal rather than just a bounce. At that stage, the full phrase price ethereum would take on a more clearly bullish meaning for swing traders.
Positioning Thoughts: Navigating a Fragile Recovery
ETH is in an awkward but tradable zone. Short-term timeframes, H1 and M15, show a clean bullish trend, while the daily chart is only tentatively recovering inside a broader downtrend. Moreover, extreme fear in sentiment creates a market that can reward contrarian longs, but only if they respect the higher volatility and the overhead trend resistance.
For directional traders, the key battlegrounds are:
- Support cluster: $1,980–2,020, combining the daily pivot, 20-day EMA, and H1 and M15 EMA zones.
- Resistance cluster: $2,065–2,100, the D1 R1 and upper band area, and then the 50-day EMA near $2,240.
Staying disciplined around those zones matters more than calling exact tops or bottoms. Volatility remains high enough that both bulls and bears who size too aggressively or lean on overly tight stops are vulnerable to being shaken out before the real move develops.
In summary, the price of Ethereum currently reflects a fragile recovery with upside bias: supportive on short timeframes, cautiously constructive on the daily, but still living under the shadow of a longer-term downtrend. Managing risk around the key levels outlined above is more important than having a strong directional conviction either way right now.
You May Also Like

Bitcoin blijft sterk terwijl altcoins massaal in het rood staan

The Future of MarTech: Key Trends Shaping Marketing Technology Through 2030
