

Dogecoin (DOGE) Price: Will History Repeat With Another Explosive Breakout?
TLDR
- DOGE is trading around $0.214 and testing support at the 200-day moving average of $0.211
- Whales have sold 250 million DOGE tokens since August 25, creating downside pressure
- Funding rates turned negative, showing more traders betting on price declines
- Technical pattern mirrors historical triangle formations from 2016 and 2020 that led to major rallies
- Key resistance levels sit at $0.253 and $0.370, with major target at $0.723
Dogecoin is facing a critical test at its 200-day moving average of $0.211 as bears build pressure on the meme coin. Trading around $0.214 at the time of writing, DOGE sits at a key technical level that could determine its next major move.
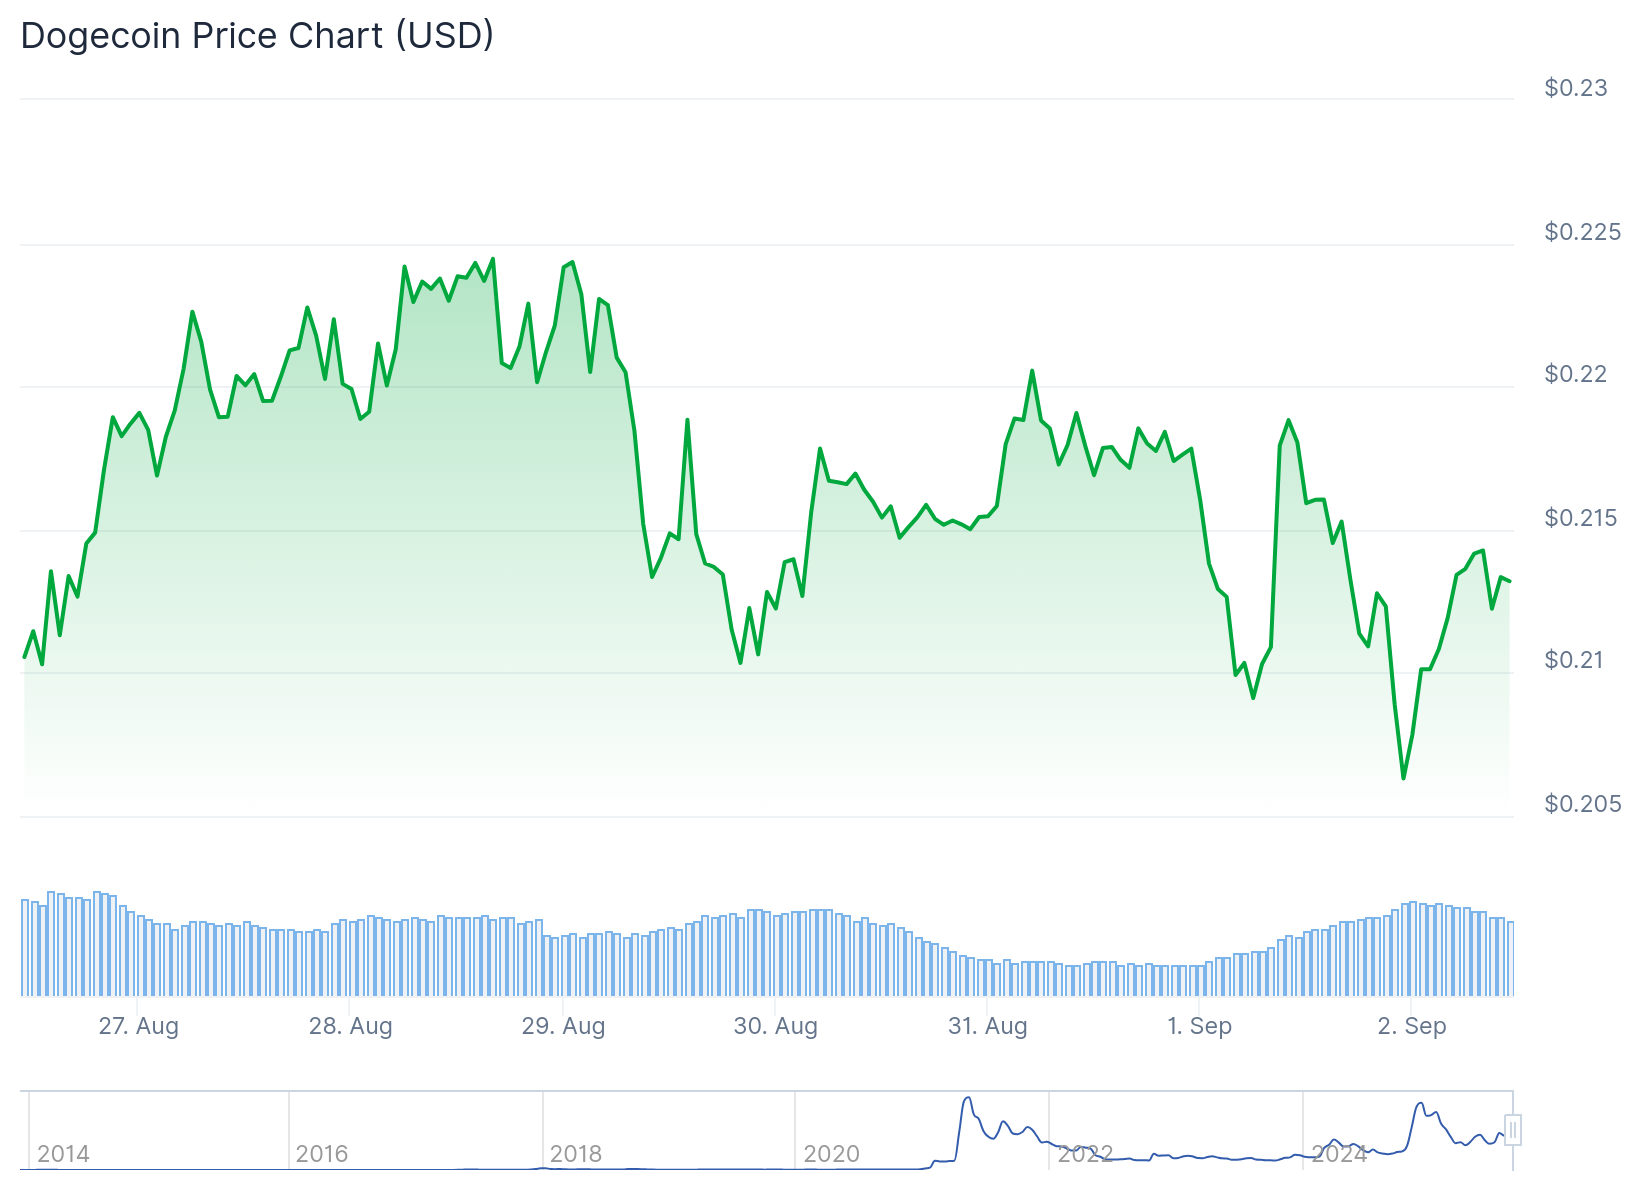 Dogecoin (DOGE) Price
The dog-themed cryptocurrency has been forming what analysts describe as a triangle pattern. This formation mirrors similar setups from 2016 and 2020 that preceded massive price rallies.
Analyst @galaxyBTC highlighted how DOGE is pushing against a descending resistance line while maintaining support above an ascending trend. If this pattern continues, it could set the stage for another explosive move higher.
However, current market conditions show growing bearish sentiment. Derivatives data from CoinGlass reveals that funding rates have flipped negative to -0.0010%. This means short sellers are paying long holders, indicating more traders expect the price to fall.
The long-to-short ratio also supports this bearish view. More traders are placing bets on DOGE declining rather than rising. Historically, when funding rates turn negative, DOGE’s price has often followed with downward movement.
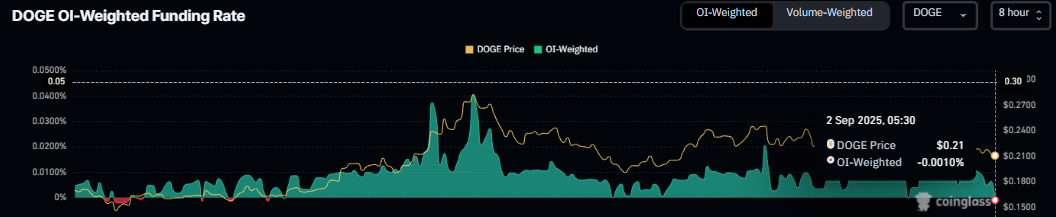 Source: Coinglass
Whale Activity Creates Selling Pressure
On-chain data from Santiment shows large holders have been reducing their positions. Whales holding between 100,000 and 1 million DOGE have been selling. The same pattern appears among holders with 1-10 million and 10-100 million tokens.
Together, these whale groups have offloaded 250 million DOGE tokens since August 25. This selling activity adds downward pressure on the price.
The combination of negative funding rates and whale selling creates headwinds for any potential breakout. These metrics suggest institutional and retail traders alike are taking a cautious approach.
DOGE found rejection at a previously broken ascending trendline on Sunday. The coin declined nearly 3% the following day, bringing it to current levels around the 200-day moving average.
Technical Levels Show Mixed Signals
The Relative Strength Index sits at 46, below the neutral level of 50. This reading suggests bearish momentum in the short term. The MACD indicator also shows a bearish crossover, reinforcing the negative outlook.
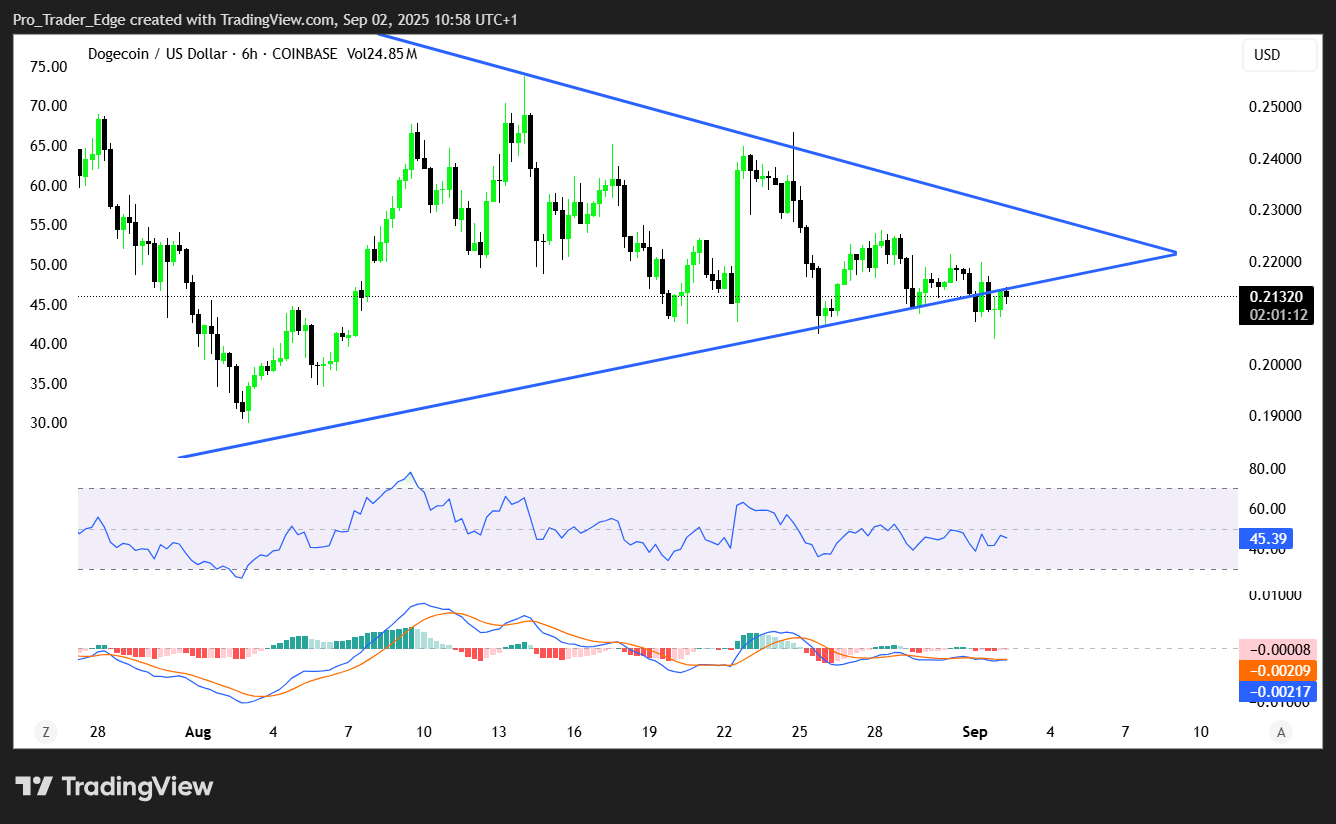 Source: TradingView
If DOGE closes below $0.211 on a daily basis, the next support level sits at $0.181. This represents the weekly support level and could become the target if selling pressure increases.
On the upside, resistance levels wait at $0.253 and $0.370. Breaking these zones could open the path toward $0.723, which represents DOGE’s 2021 peak.
The triangle pattern that analysts are watching has been tightening over several months. Similar formations in 2016 and 2020 led to explosive upward moves after extended consolidation periods.
If the 200-day moving average at $0.211 holds as support, DOGE could recover toward the daily resistance at $0.247. This would keep the triangle pattern intact and maintain the potential for a breakout.
The current setup presents conflicting signals. While short-term metrics point to bearish pressure, the long-term pattern suggests potential for another major rally if resistance breaks.
Traders are closely watching the $0.211 level as it could determine whether DOGE extends its correction or begins another leg higher toward historical resistance zones.
The post Dogecoin (DOGE) Price: Will History Repeat With Another Explosive Breakout? appeared first on CoinCentral.
You May Also Like

Is Putnam Global Technology A (PGTAX) a strong mutual fund pick right now?

“Vibes Should Match Substance”: Vitalik on Fake Ethereum Connections
