

Solana price outlook: Fresh lows under $75 possible as sentiment cools and funding rates flip negative
Solana price hovers near $80 as bearish sentiment grows and key support at $75 comes into focus.
- Solana price outlook is still bearish as SOL trades near the lower end of its weekly range.
- Funding rates have flipped negative while open interest climbs, showing growing short exposure.
- Loss of the $75 level could trigger a move toward the $70–$60 zone.
Solana traded at $81.67 at press time, down 3.7% in the past 24 hours. Over the last seven days, SOL has ranged between $76.81 and $90.59, hovering close to the lower end of that band.
The decline has been persistent. Solana (SOL) is down 38% over the past 30 days and 50% over the past year. Each bounce has been capped by lower highs, keeping pressure on the chart.
In derivatives markets, activity remains elevated. CoinGlass data shows futures volume up 6% to $8.01 billion, while open interest rose 3% to $5.24 billion. When open interest increases as price falls, it often reflects new short positions being added rather than longs exiting. In effect, traders are leaning bearish.
Hype fades as funding turns negative
According to a Feb. 19 report from Santiment, the excitement that surrounded Solana in 2025 has largely faded. The token is now down 67% from its $249 high on Sept. 18, 2025. Social dominance, which once stood above 6%, has dropped below 0.4% daily.
Network-related concerns have also weighed on sentiment. In January, maintainers urged validators to upgrade to Agave/Jito v3.0.14 after two critical vulnerabilities were disclosed. One issue could crash validator nodes, while another involved vote processing and raised questions about consensus integrity.
Although fixes were delivered quickly, the urgency highlighted how co-ordination affects and confidence.
Infrastructure discussions re-surfaced again after a Feb. 4 disruption, when traffic across the continental U.S. was temporarily rerouted through Europe and Asia. While rerouting is common in networking, performance consistency matters on high-speed chains and massively affect user sentiment.
Santiment also noted that the memecoin mania that once fueled record trading activity on the chain has faded, alongside NFT launches. Funding rates, however, have flipped deeply negative. Shorts are paying longs. Extended negative funding can create conditions for a squeeze if price stabilizes, but for now, it reflects dominant bearish positioning.
These factors have weakened the technical outlook for SOL, with a possible retest of the $50 to $60 range if sellers stay in control. Despite price weakness, daily network growth has increased. New wallet creation has continued to rise, showing that activity has not disappeared.
Solana price technical analysis
The daily chart shows a clear bearish structure. Lower highs and lower lows have formed for weeks. SOL trades below the 50-day and 200-day moving averages, and the 50-day sits under the 200-day in a death cross alignment. The slope of both averages points downward.
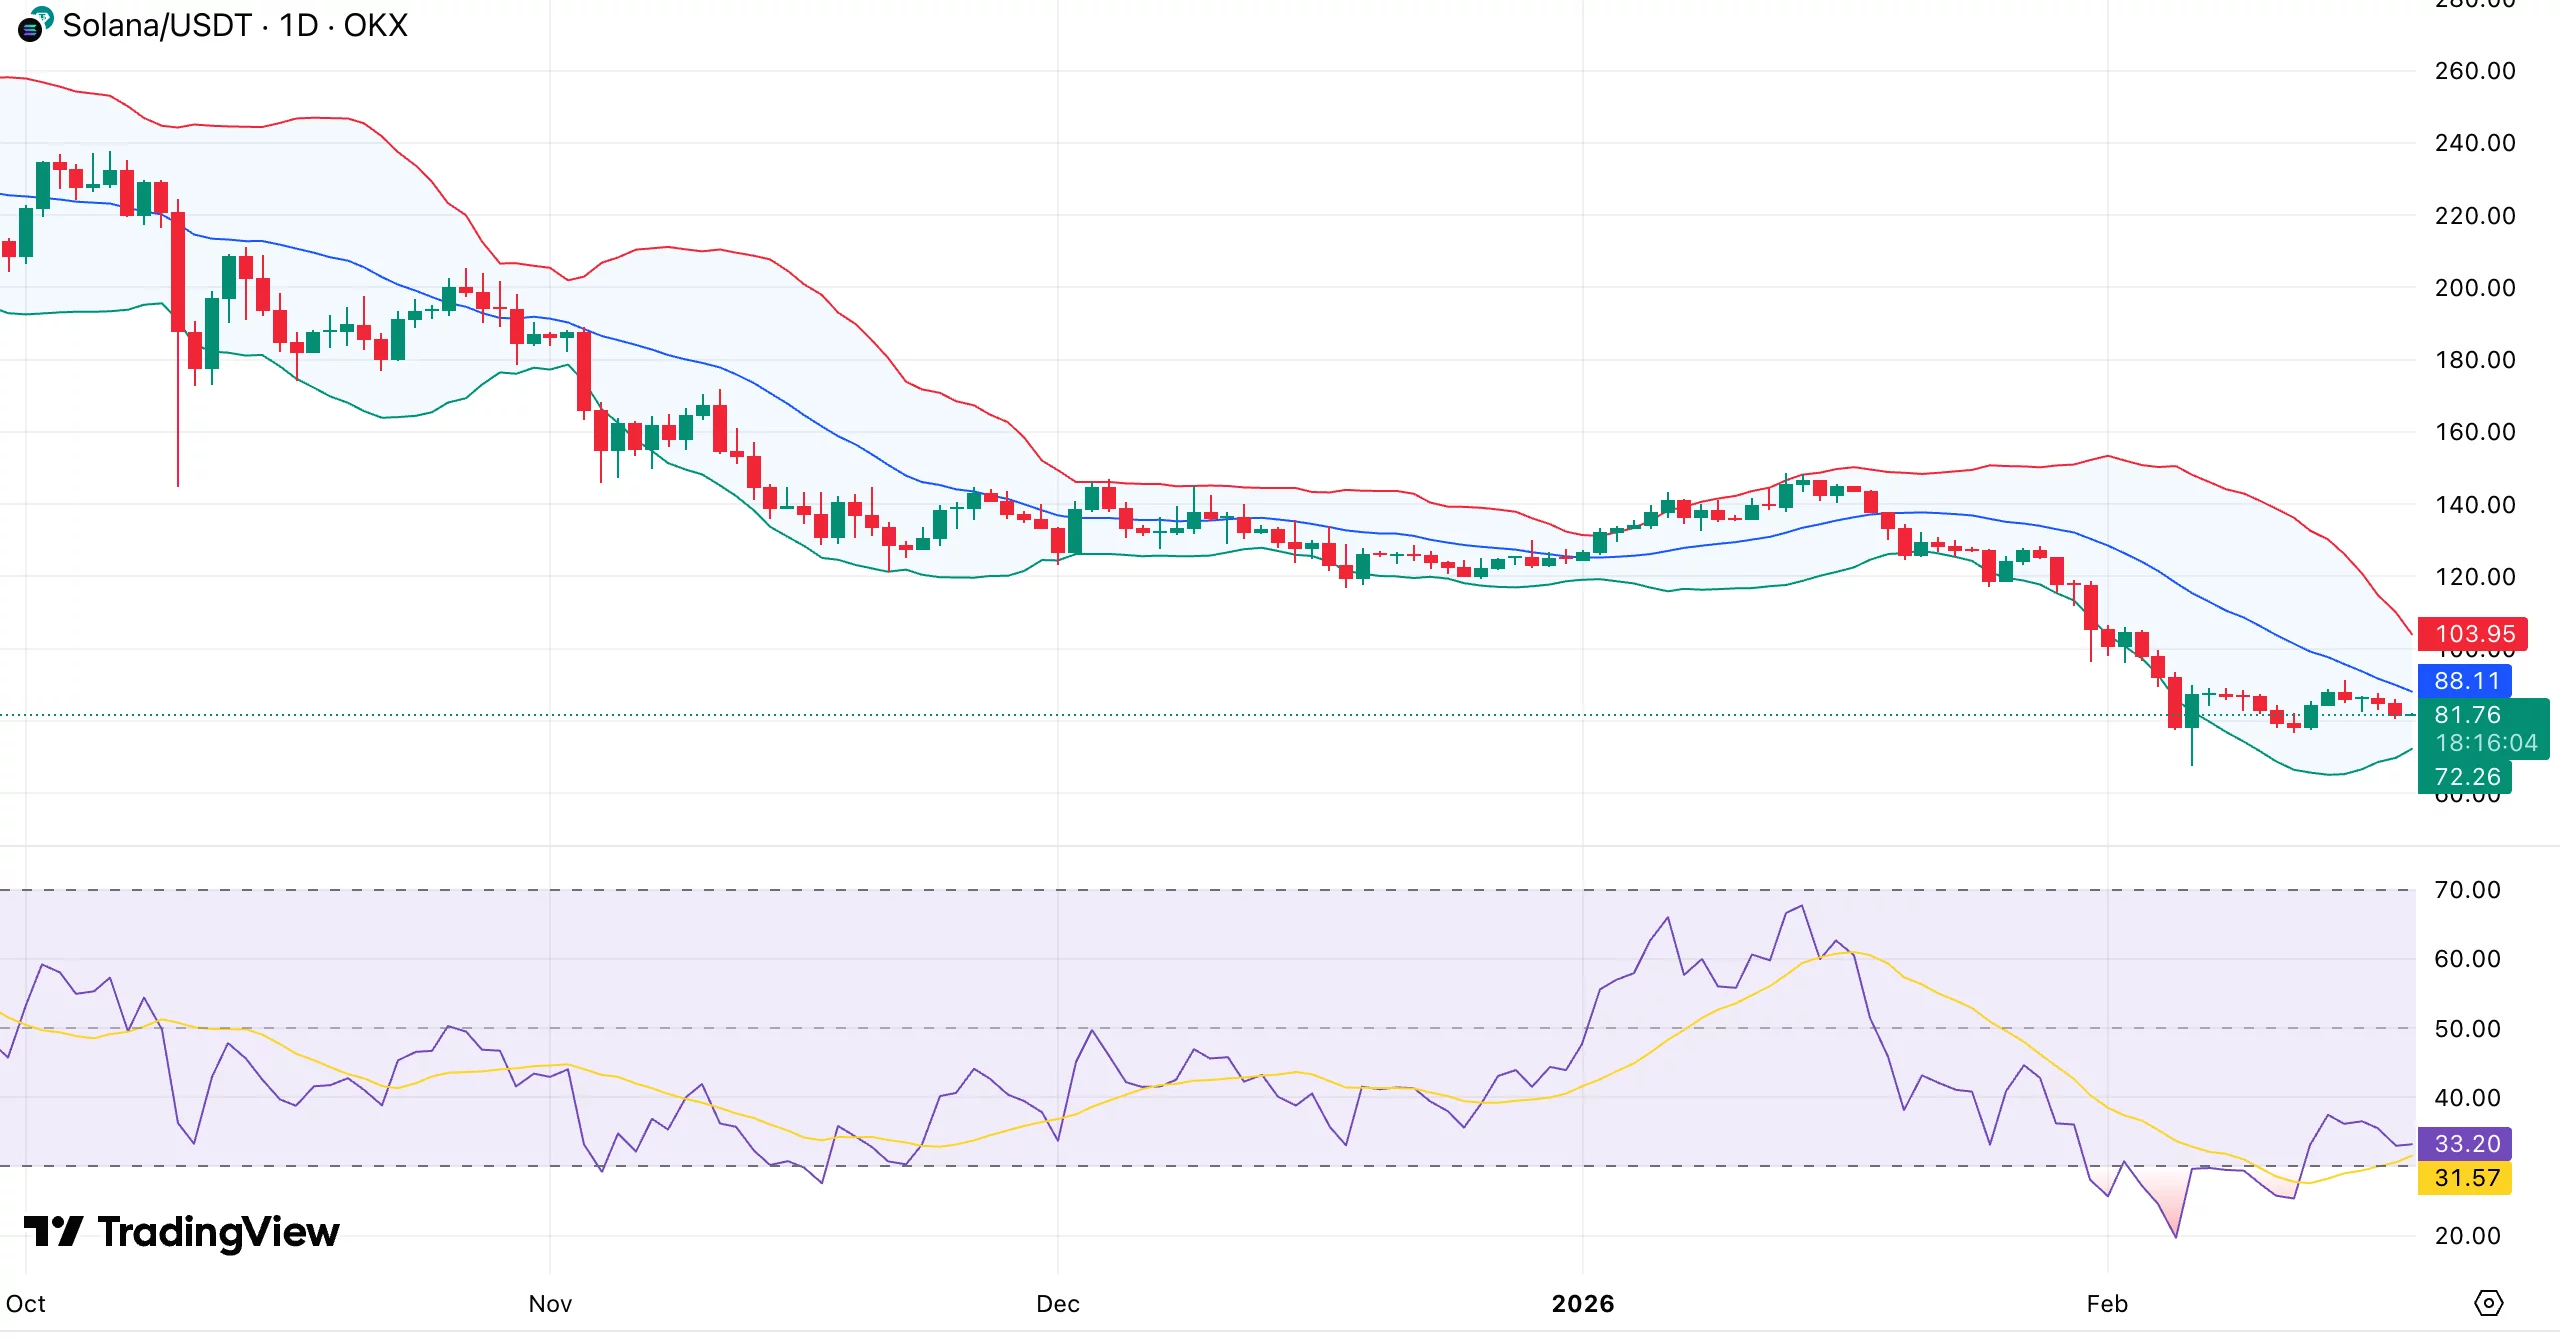
The recent bounce failed near the $90–$100 supply zone, which now acts as strong resistance. Dynamic resistance sits around $88–$95, where short-term moving averages cluster.
Momentum is weak. The daily RSI is near 33, hovering just above oversold territory. It has not reclaimed the 50 midline, which keeps sellers in control. Oversold readings can produce quick bounces, but they do not confirm reversals on their own.
Price has been riding the lower Bollinger Band. The bands have widened during the sell-off, showing increased volatility. There has been no sustained move back toward the mid-band (20-day average).
Key support sits at $80–$82, followed by the psychological $75 level. Below that, the next demand zone appears near $70–$72. A deeper slide could expose the $60 region, which aligns with prior macro structure.
On the upside, resistance stands at $88–$90, then $100. A recovery above $100 on strong volume would weaken the bearish case. For that to happen, RSI would need to push above 50, funding would need to stabilize, and price would need to form a higher low above $80.
You May Also Like

JANCTION Forges Alliance with AltLayer to Enhance Blockchain Interoperability

SAP Proposes Dividend of €2.50 per Share

Investors Pull Millions from Bitcoin and Ethereum ETFs Ahead of Powell’s Speech
Highlights: Investors withdrew millions from Bitcoin and Ethereum ETFs ahead of Powell’s speech. Bitcoin trades near $113,000 support, while Ethereum holds just above $4,200 levels. Analysts see mixed trends, citing liquidity sell-offs and weakening on-chain profitability signals. A few hours before Fed Chair Jerome Powell spoke at 11:30 a.m. ET, investors pulled large amounts from Bitcoin and Ethereum ETFs. This showed caution in the market. Bitcoin is trading near key support levels, and Powell’s speech could decide its next direction. Bitcoin ETFs See Major Outflows On September 22, neither spot Bitcoin ETFs nor Ethereum ETFs had any new inflows, reflecting a risk-off mood among investors. Bitcoin ETFs posted a total net outflow of $363.17 million, led by Fidelity’s FBTC with $276.68 million. Ark & 21Shares followed with $52.30 million, Grayscale’s GBTC withdrew $24.65 million, and VanEck’s HOLD had a small sale of $9.54 million. Overall trading reached $3.43 billion, with total net assets at $148.09 billion, showing strong user activity and growing confidence in the asset. This represents 6.59% of the total Bitcoin market capitalization. Ethereum ETFs Face $76 Million Outflow On the other hand, Ethereum ETFs recorded a total net outflow of $75.95 million on Monday. Fidelity’s FETH led with $33.12 million, followed by Bitwise ETHW and Grayscale ETH at $22.30 million and $5.4 million, respectively. BlackRock’s ETHA withdrew $15.07 million. None of the nine ETFs saw any inflows that day. The total trading value of Ethereum ETFs reached $2.06 billion, showing steady market activity and a strong industry position. Net assets stood at $27.52 billion, representing 5.45% of Ethereum’s total market capitalization. The outflows follow a pattern of ups and downs seen earlier this year. Ethereum ETFs saw a change in investor interest. Fidelity and Bitwise led most of the withdrawals. BlackRock’s iShares Ethereum ETF had some inflows that partially balanced the trend. Since their launch in July last year, spot Ethereum ETFs have gathered more than $13 billion in total net inflows. Meanwhile, Grayscale’s legacy trust experienced outflows exceeding $4.5 billion, as investors shifted to newer, lower-fee options. Outflows often happen when Bitcoin’s price becomes volatile. Investors usually pull funds if the price drops below key support levels. On September 22, spot Bitcoin ETFs recorded total net outflows of $363 million, with none of the 12 funds seeing inflows. Spot Ethereum ETFs saw total net outflows of $75.95 million, with all nine funds posting no inflows.https://t.co/Hj2Gs49bWa pic.twitter.com/YqCrJSMnIg — Wu Blockchain (@WuBlockchain) September 23, 2025 Fed’s Recent Rate Cut and Market Impact Today’s speech follows the Fed’s recent rate cut. The quarter-point cut lowered rates to 4.00%-4.25%. Powell said the move was for risk management, not aggressive easing. He added that risks to jobs have increased. The Fed decided to take another step toward a neutral policy. Markets are waiting to see if the Fed will stay cautious or signal more rate cuts. This decision could guide Bitcoin’s next move. BTC is trading around $113,000, with support near $111,000. Ethereum is just above $4,200. The Fear & Greed Index is at 40, showing neutral sentiment. Analysts have different views. Joao Wedson from Alphractal says BTC’s cycle “is losing momentum” as on-chain profits fall. Michaël van de Poppe refers to the drop as a “classic liquidity sell-off” which could trigger a rebound. Altcoins now come into view for some analysts as the next opportunity. The altcoin-season index last reached a record high since last year with rising rotation. Bitcoin is already showing signs of cycle exhaustion — and very few are seeing it. The SOPR Trend Signal is excellent at signaling when blockchain profitability is drying up.Never in Bitcoin’s history have investors accumulated BTC so late and at such high prices.Maybe only… pic.twitter.com/I1GBdEJH03 — Joao Wedson (@joao_wedson) September 22, 2025 eToro Platform Best Crypto Exchange Over 90 top cryptos to trade Regulated by top-tier entities User-friendly trading app 30+ million users 9.9 Visit eToro eToro is a multi-asset investment platform. The value of your investments may go up or down. Your capital is at risk. Don’t invest unless you’re prepared to lose all the money you invest. This is a high-risk investment, and you should not expect to be protected if something goes wrong.