

Solana Tests Lower Levels: Will the 4% Slide Trigger Further Losses or a Bounce?
- After a 4% drop, Solana is trading around $81.
- The SOL market recorded $9.13M in liquidations.
With the 2.62% plunge, the market cap has slipped to $2.31 trillion. The broader sentiment is extreme fear, and the majority of the crypto assets are charted in red, pushing the price to recent lows. The largest asset, Bitcoin (BTC), is trading at $67.5K, while Ethereum (ETH), the largest altcoin, hovers at $1.9K. Among the altcoins, Solana (SOL) has posted a 4.87% loss.
The asset kicked off the day trading at a high of $85.90, and the bearish encounter within the SOL market triggered the price to retrace toward a bottom of $81.87. At the time of writing, Solana traded in the $81.88 range, with its daily trading volume having dropped by over 12.93%, to $3.4 billion. As per Coinglass data, the SOL market has seen a 24-hour liquidation of $9.13 million.
The recent bearish pressure could push the Solana price down to its crucial support at around $78.36. If a steady correction on the downside occurs, it might initiate the death cross to take place, and send the price toward $75.21 or even lower.
On the upside, assuming a reversal in the SOL market, the price might move up and find the nearest resistance at $84.59. With a breakout above this level, the golden cross could emerge, and the bulls would likely drive the price above $87.66.
Bearish Signals Emerge on Solana’s Technical Chart
Solana’s technical analysis displays that the Moving Average Convergence Divergence (MACD) and signal lines are below the zero line. It indicates the strengthening downtrend. The price is trading below its longer-term average, and a sustained move above zero may affirm a trend reversal.
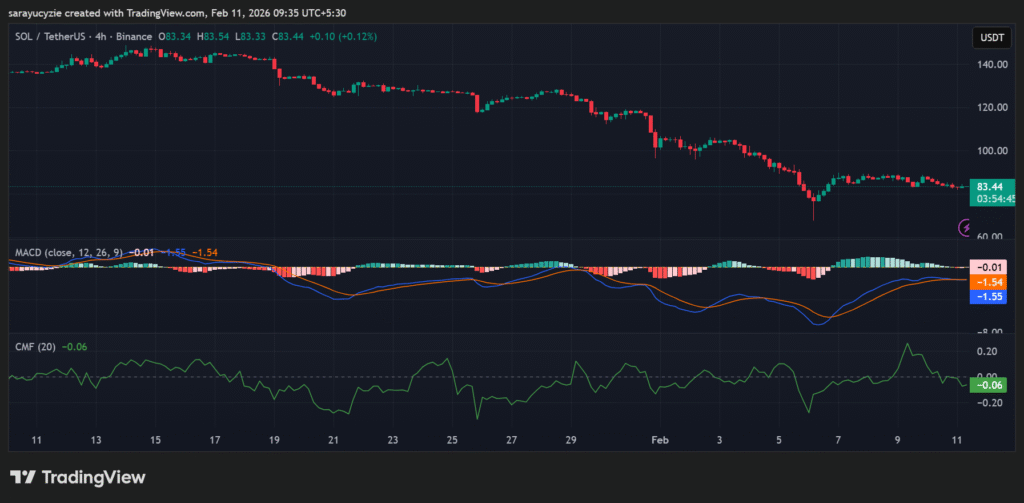 SOL chart (Source: TradingView)
In addition, the Chaikin Money Flow (CMF) indicator settled at -0.06, suggesting mild selling pressure in the SOL market. The money outflows slightly outweigh inflows, showing that the demand is weakening. If the value continues to drop further below zero, it confirms a strong bearish momentum.
The daily Relative Strength Index (RSI) of Solana is found at 39.13 signals a weak sentiment with bearish bias. As it is below the neutral level, the sellers have more control, but it is not yet in oversold territory. Notably, there is room for either further downside or a short-term bounce.
Furthermore, the Bull Bear Power (BBP) reading of SOL at -3.00 hints at strong bearish dominance. Significantly, the asset is trading below its key moving average. Unless this value starts moving back toward the zero mark, the downside pressure is likely to persist.
Top Updated Crypto News
Bankman-Fried Petitions Federal Court for Retrial in FTX Collapse Case
You May Also Like

‘Compromise is in the air’: Ripple CLO signals progress on crypto bill

TrendX Taps Trusta AI to Develop Safer and Smarter Web3 Network
