Sub‑$80k and oversold: what Bitcoin price today signals for the market

Markets are showing real fear as Bitcoin price today hovers just above key daily support, with liquidity stress and risk-off sentiment driving conditions.
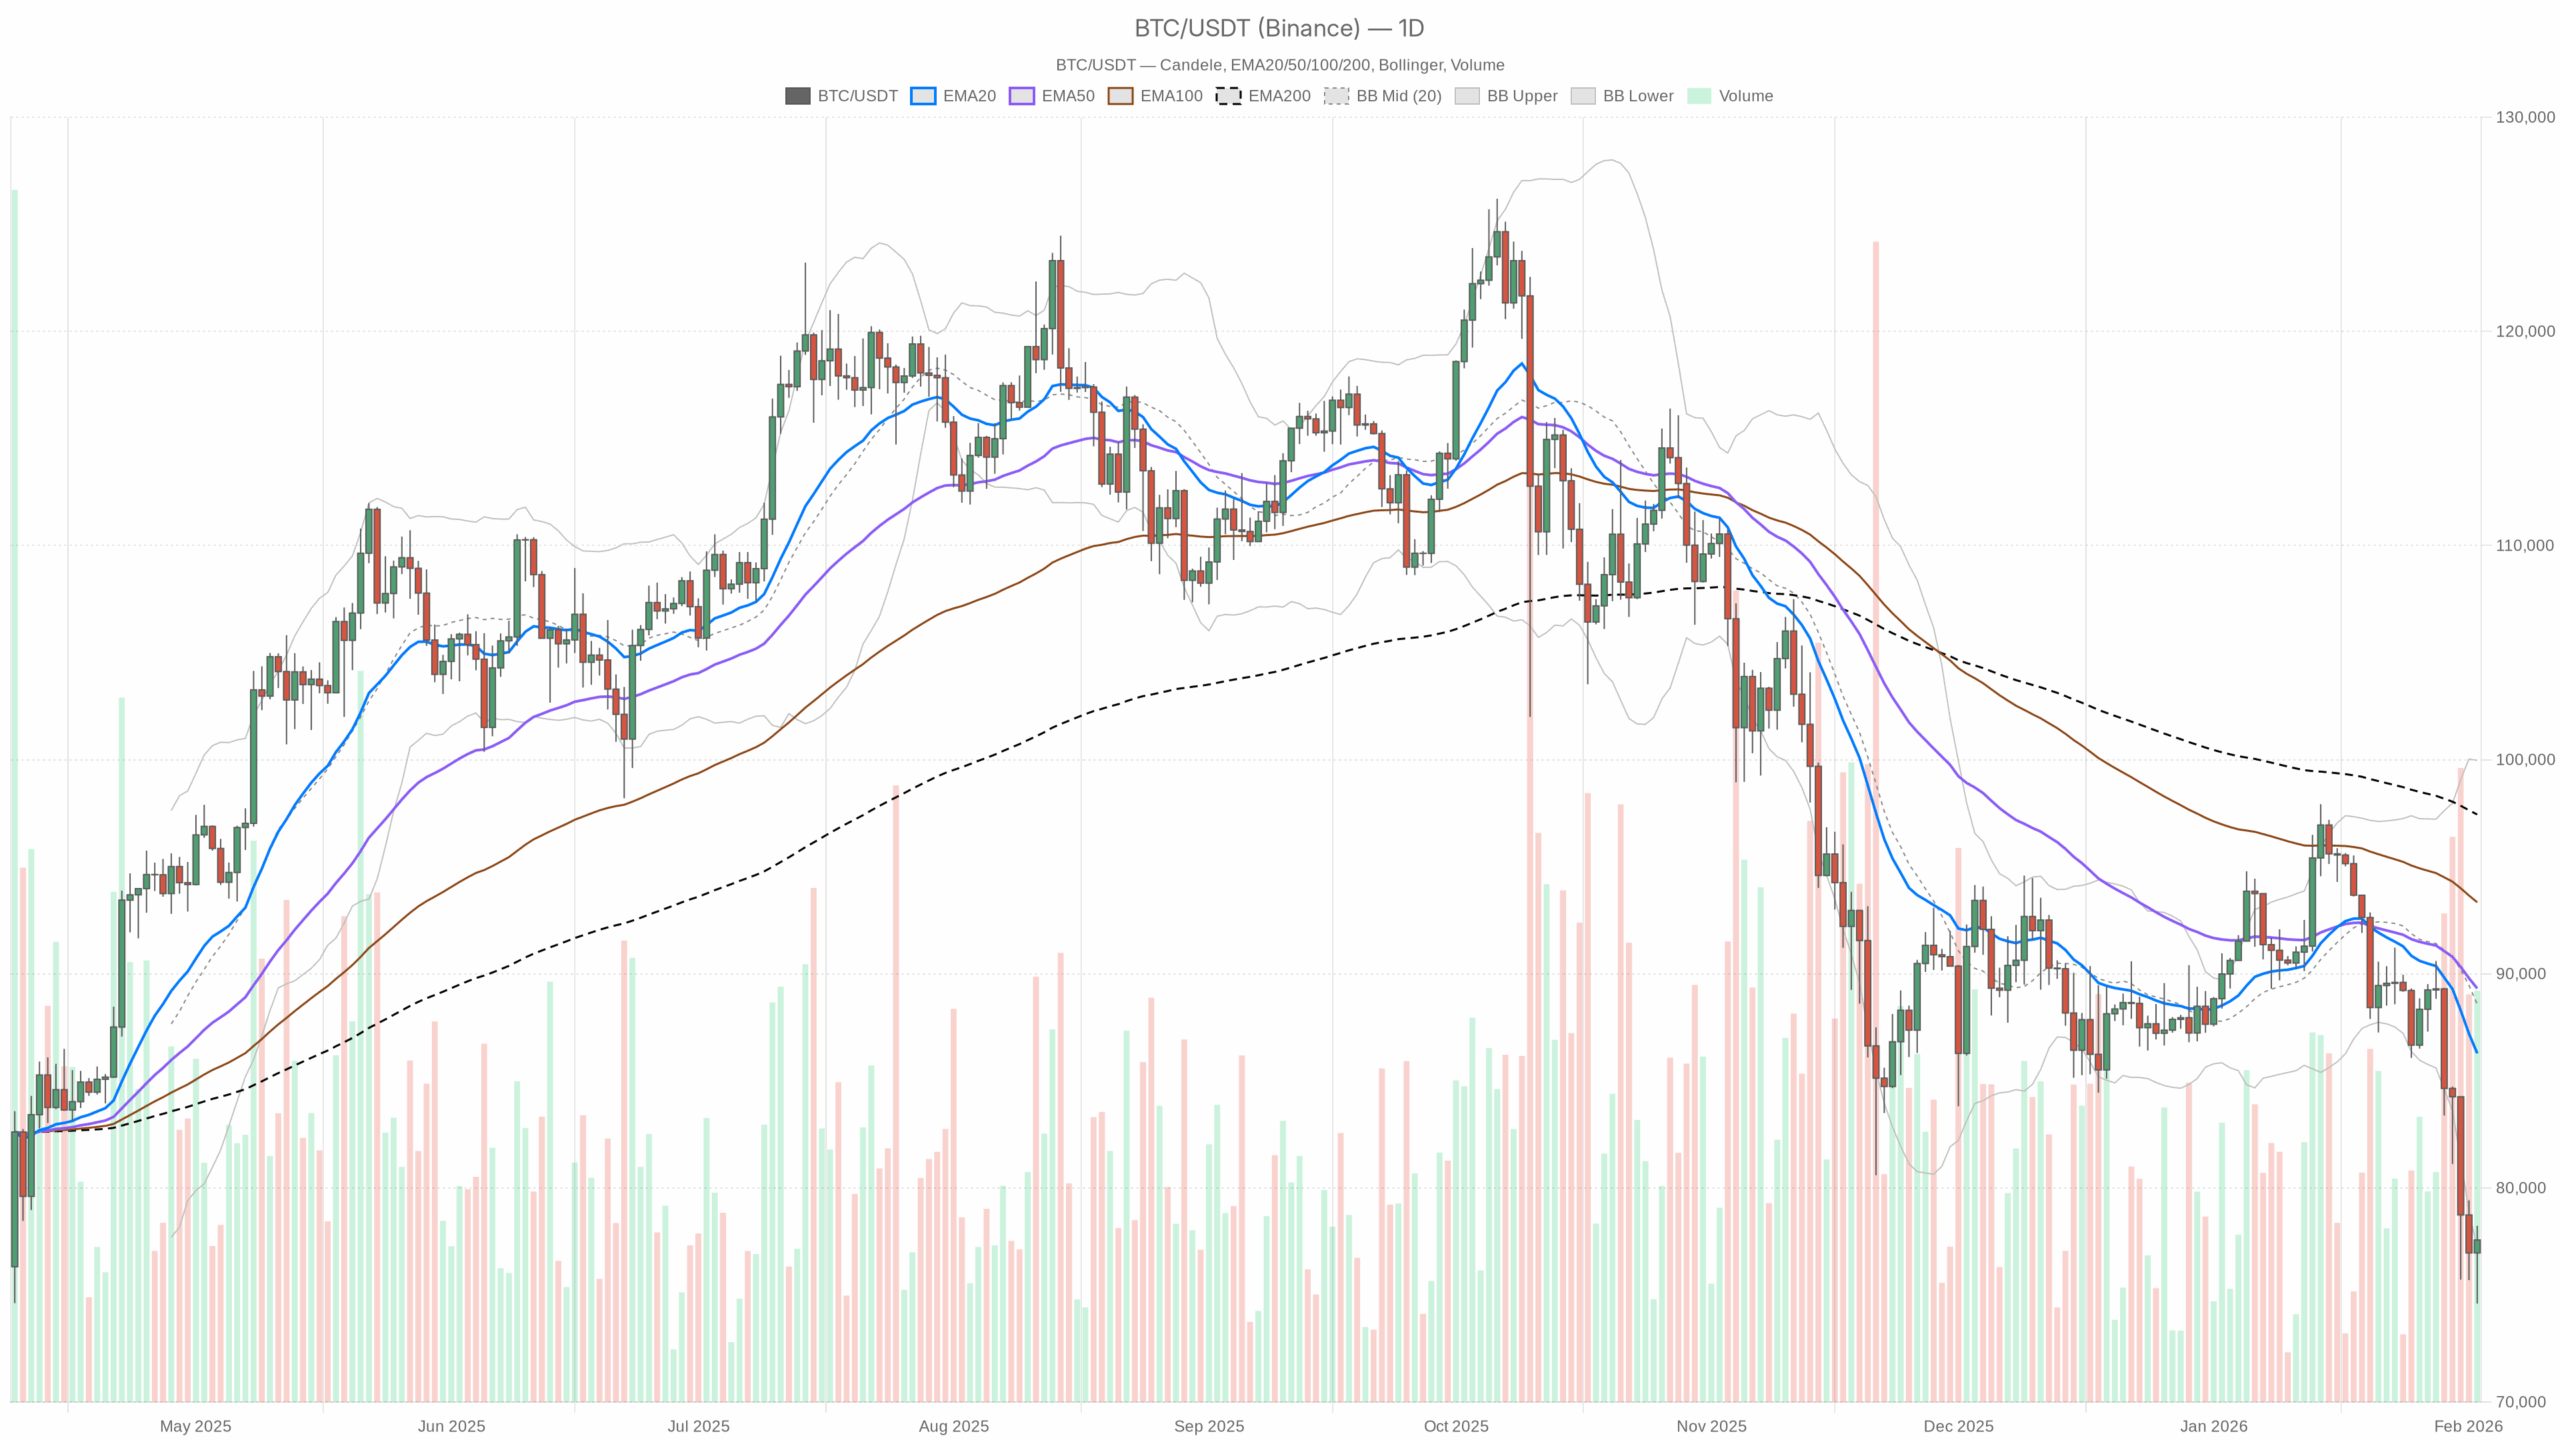 BTC/USDT daily chart with EMA20, EMA50 and volume”
loading=”lazy” />BTC/USDT — daily chart with candlesticks, EMA20/EMA50 and volume.
Daily chart (D1): primary trend is bearish
Trend structure and EMAs
– Price: $77,570
– EMA 20: $86,292
– EMA 50: $89,319
– EMA 200: $97,441
– Regime flag: bearish
Bitcoin is trading well below all three key EMAs, with the 20 < 50 < 200 configuration fully stacked to the downside. That is a textbook downtrend profile: rallies into the low–mid $80ks are, for now, rallies into supply, not the start of a new bull leg. To repair this, BTC would need to reclaim the 20-day EMA and hold above it. Currently, price is roughly $8,700 below that line, which is a big gap for spot buyers to chew through.
RSI (momentum and exhaustion)
– RSI 14 (D1): 25.35
Daily RSI is deep in oversold territory. That tells you two things at once: (1) the downtrend is strong, and (2) the market is reaching a zone where counter-trend bounces become more likely. Historically, when daily RSI gets this compressed, you often see violent short-covering rallies. However, in bear regimes, these can be brief and still resolve lower. In other words, the market is stretched, but not obligated to bottom here.
MACD (trend strength)
– MACD line: -3057
– Signal line: -1563
– Histogram: -1494 (negative)
MACD on the daily is firmly negative with the line below the signal and a wide negative histogram. That confirms the bearish momentum is still in control. There is no sign yet of a bullish crossover forming. From a trend follower’s perspective, the path of least resistance on the daily timeframe is still down or sideways-down, not a clean V-shaped reversal.
Bollinger Bands (volatility and extremes)
– BB mid: $88,579
– BB upper: $99,966
– BB lower: $77,192
– Price: $77,570 (near lower band)
Bitcoin is trading right on top of the lower daily Bollinger Band. Price is effectively hugging the lower edge of the volatility envelope. That often coincides with panic or forced selling and can precede short-term mean reversion. However, when a market rides the lower band in a bear regime, it can grind lower for days while staying oversold. So this is not a clean buy signal; it is a warning that late shorts are now chasing price into a stretched zone.
ATR (volatility and risk)
– ATR 14 (D1): $3,474
Daily ATR around $3.5k means a typical daily swing is about 4.5% of current price. Volatility is elevated, but not at capitulation levels. For positioning, this means stop placement has to be wide relative to normal conditions, and size should usually be scaled down if you are trading off the daily chart. It also opens the door for sharp intraday reversals that do not change the bigger bearish structure.
Daily pivot levels
– Pivot point (PP): $76,802
– R1: $79,000
– S1: $75,373
Price is currently hovering slightly above the daily pivot. In practice, that means the market is fighting over direction intraday right around a key reference level. A push above $79k (R1) would open the door to a deeper bounce toward the low $80ks, while a break below $75.4k (S1) re-exposes the downside with room for another ATR-sized leg lower.
Hourly chart (H1): short-term stabilization inside a downtrend
Trend and EMAs
– Price: $77,569
– EMA 20: $77,216
– EMA 50: $78,670
– EMA 200: $83,546
– Regime flag: neutral
On the 1-hour chart, price is now back above the 20-hour EMA but still below the 50 and 200. That lines up with a short-term basing or pause inside a larger downtrend. Intraday, sellers are no longer in absolute control, but the structure is still that of a rally within a broader bearish context. The 50-hour EMA around $78.7k is the first meaningful intraday resistance. Moreover, the 200-hour near $83.5k is where a real squeeze would start to threaten the bearish narrative.
RSI (intraday momentum)
– RSI 14 (H1): 50.55
Hourly RSI is basically neutral. Momentum has cooled off after the selloff, and the market is trying to decide whether this is a pause before another leg lower or the start of a larger bounce. There is no clear edge here from momentum alone on this timeframe.
MACD (intraday trend shift)
– MACD line: -460
– Signal line: -665
– Histogram: +205
The MACD line is still negative, but it has crossed above the signal with a positive histogram. That is what early intraday bullish divergence and mean reversion typically looks like. It does not flip the daily bias, but it does say that shorts are starting to take profits and dip buyers are testing the waters.
Bollinger Bands (H1)
– BB mid: $77,032
– BB upper: $78,347
– BB lower: $75,717
– Price: $77,569
On the hourly chart, BTC is trading between the midline and the upper band. The selling pressure from earlier sessions has eased and price is consolidating within the band range. That is consistent with a cool-down after an impulsive move, where volatility compresses before the next leg.
ATR and intraday pivots
– ATR 14 (H1): $1,219
– Pivot point (PP): $77,640
– R1: $77,805
– S1: $77,404
An hourly ATR around $1.2k shows that intraday swings of 1.5% are normal here. Price is trading almost exactly at the hourly pivot, a classic tug-of-war zone. The $77.8k area (R1) is the immediate resistance for scalpers. If price can build acceptance above there, it starts to open the way toward $79k–80k. Lose $77.4k decisively, and the market likely re-tests the daily pivot and the low-$76ks.
15-minute chart (M15): execution context only
Local trend and EMAs
– Price: $77,569
– EMA 20: $77,042
– EMA 50: $76,911
– EMA 200: $78,482
– Regime flag: neutral
On the 15-minute chart, price is above the 20 and 50 EMAs but still under the 200 EMA. Very short term, buyers are pressing the tape higher after the dump, but they are still trading under a heavier, longer-term moving average. This is exactly what a counter-trend bounce inside a downtrend looks like. It is good for entries and risk placement, but not a timeframe to judge the big picture from.
RSI and MACD (M15)
– RSI 14 (M15): 61.82
– MACD line: +337
– Signal line: +230
– Histogram: +106
Short-term RSI is in the bullish side of neutral, and MACD is positive with the line above the signal. Locally, momentum is with the buyers. This supports the idea of an ongoing intraday bounce, but with RSI not yet overbought, there may still be a bit of room higher before local exhaustion kicks in. Again, this is tactical noise against a bearish daily backdrop.
Bollinger Bands and ATR (M15)
– BB mid: $76,895
– BB upper: $78,085
– BB lower: $75,704
– ATR 14 (M15): $361
Price is leaning toward the upper 15-minute band, showing short-term buying pressure. With a 15-minute ATR of about $360, local swings of roughly 0.5% in either direction are standard. For short-term traders, this is a tradable bounce zone, but they are still operating under the shadow of the daily downtrend.
Market regime and sentiment
This moment matters because the data is finally showing real fear. The crypto Fear and Greed Index is down at 14 – Extreme Fear, BTC dominance is elevated at ~57.6%, and the total crypto market cap is down ~1.2% over 24 hours. Capital is defensive and crowded into BTC relative to alts, but even Bitcoin is being sold. Structurally, this is a bearish market regime on the daily with only short-term pockets of mean reversion showing up on intraday charts.
Macro newsflow in 2024 — liquidity concerns, metals crashing, headlines about the longest losing streak since 2018 — is lining up with what the chart already shows: forced selling, deleveraging, and a preference for cash over risk.
Scenarios from here
Bullish scenario (counter-trend bounce first)
For the bulls, the realistic next step is not an immediate new all-time high, but a short-covering rally out of oversold conditions.
A constructive bullish path would look like this:
1. Hold above daily S1 around $75.4k on any further dips. Ideally, price continues to respect the daily pivot near $76.8k on a closing basis.
2. The hourly structure transitions from neutral to bullish: price reclaims and holds above the 50-hour EMA (~$78.7k) and then pushes into the $80k–82k pocket.
3. MACD on the daily starts to contract in its negative histogram and curves higher, while RSI lifts back above 30–35, signaling momentum loss on the downside.
If that unfolds, the market could see a squeeze toward the $83.5k–86k zone where the H1 200 EMA and the D1 20 EMA start to come into play. That would still be just a rally within a broader downtrend unless BTC can close multiple days above the daily 20-EMA (~$86k) and then attack the $89k–$90k zone (near the 50-day EMA).
What invalidates the bullish bounce case?
A clean daily close below $75k with follow-through lower the next day would strongly argue that the market is not done liquidating. In that case, the oversold bounce narrative fails and price is likely heading into another leg down, with new supports needing to be discovered lower.
Bearish scenario (trend continuation)
The current dominant scenario remains trend continuation to the downside.
Key ingredients for that outcome:
1. The intraday bounce stalls below $79k–$80k, keeping price under hourly resistance and under the 50-hour EMA.
2. RSI on H1 rolls back down from neutral or positive territory without ever pushing into sustained strength, while M15 momentum flips over from its current bullish stance.
3. On the daily, price closes below the lower Bollinger Band ($77.2k) and under S1 ($75.4k), turning what is currently an oversold touch into a band breakdown.
If that plays out, the market moves into classic grind-lower or flush-lower territory: ATR of $3.5k leaves plenty of room for a quick extension downward. With Extreme Fear already at 14, another leg could start forcing weak hands to capitulate. In that kind of tape, bounces into the low–mid $80ks remain sell zones until the daily trend structure changes.
What would weaken or invalidate the bearish continuation case?
Bears start losing the upper hand if BTC:
– Reclaims and holds above $80k on the daily close, and
– Then spends several sessions above the daily 20 EMA (~$86k) with the daily RSI pushing back above the mid-40s and MACD flattening.
That combination would tell you the downtrend is losing its grip, and the market is transitioning into either a broader range or a new accumulation phase.
Positioning, risk, and how to think about Bitcoin here
The key point: Bitcoin price today is in a bearish daily regime with oversold conditions and an early, fragile intraday bounce. Trend traders will typically respect the downside bias until the daily EMAs and momentum clearly flip back up. Mean-reversion traders will look at this as a potential opportunity zone but have to accept that they are trading against the prevailing trend.
Volatility is high enough that position sizing and stop distances matter more than usual. A normal daily noise band of $3k–4k can easily shake out tight risk management on the wrong timeframe. With sentiment in Extreme Fear, headline risk is elevated: more bad macro or liquidity news can accelerate moves both down (capitulation) and up (short squeezes), depending on positioning.
Whether traders lean bullish or bearish here should depend on which timeframe they are trading. The daily chart still favors patience and caution. Meanwhile, the hourly and 15-minute charts only justify short-term tactical plays until they align with a broader structural shift in the market.
If you want to monitor markets with professional charting tools and real-time data, you can open an account on Investing using our partner link:
Open your Investing.com account
This section contains a sponsored affiliate link. We may earn a commission at no additional cost to you.
Market analysis is inherently uncertain. The scenarios discussed here are conditional, not guarantees, and are based solely on the data available at the time of writing.
In summary, the market structure across timeframes points to a dominant daily downtrend, oversold but not yet conclusively bottomed, with only tactical counter-trend opportunities for disciplined short-term traders.
You May Also Like

CEO Sandeep Nailwal Shared Highlights About RWA on Polygon

SHIB Price Analysis for February 8