

XRP Price Stalls Below $2 Despite the $7.76 ETF Inflows as Bearish Momentum Mounts
Highlights:
- The XRP price stalls below $2.00, currently exchanging hands at $1.88.
- XRP ETFs have soared to $7.76 million, indicating investor confidence.
- The bearish technical outlook shows XRP downside risk towards $1.82 support.
The XRP price is around the trading level of $1.88 at the time of writing on Tuesday. This comes after the altcoin hit a high of $1.95 on the previous day. The cross-border remittance token is heavily strained with a poor technical outlook, as the bears take control. However, the institutional interest remains stable, but retail demand is below par, implying that traders have no confidence that XRP will be able to maintain an uptrend.
In the meantime, Exchange Traded Funds (ETFs) continue to show sustained interest in XRP, with a four-day inflow. The statistics with SoSoValue indicate that XRP spot ETFs attracted about $7.76 million in inflows on Monday.
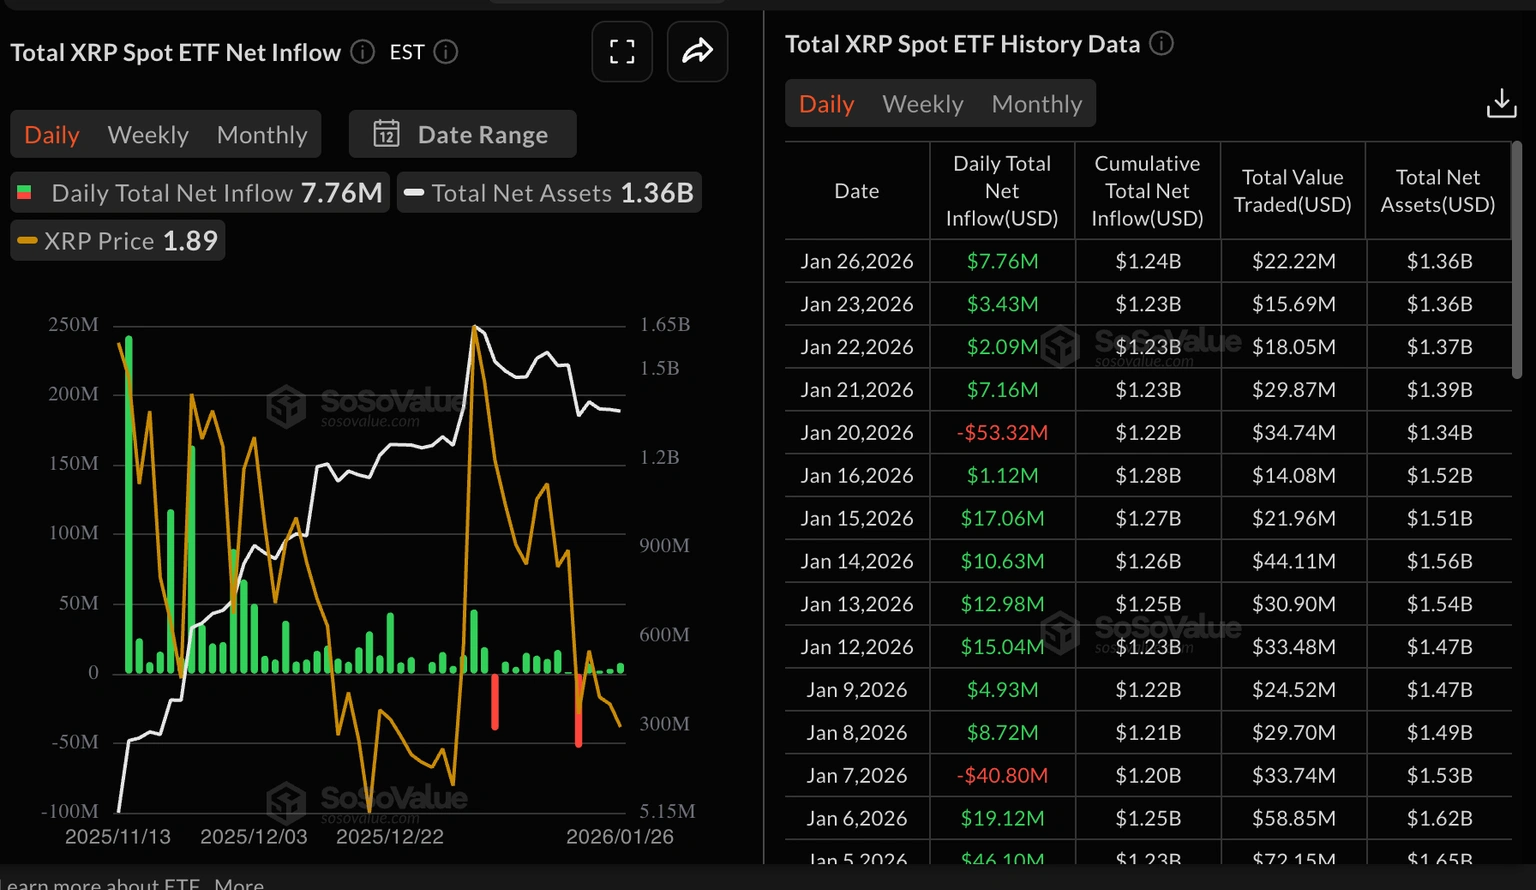 Total XRP Spot ETF Net Inflow: SoSoValue
The cumulative total inflow now is $1. 24 billion and net assets of $1.36 billion. The XRP ETF by Bitwise performed better than the rest of the products, with inflows of approximately $5.3 million.
On the other hand, XRP’s retail demand has not been able to pick up, which is in line with a lingering risk-off mood on the crypto market. On Tuesday, the futures Open Interest (OI) is at $3.39 billion, a little bit above the annual low of $3.26 billion, achieved on Monday. This slight surge marks a 2% increase, indicating a slight flow of money into the XRP market.
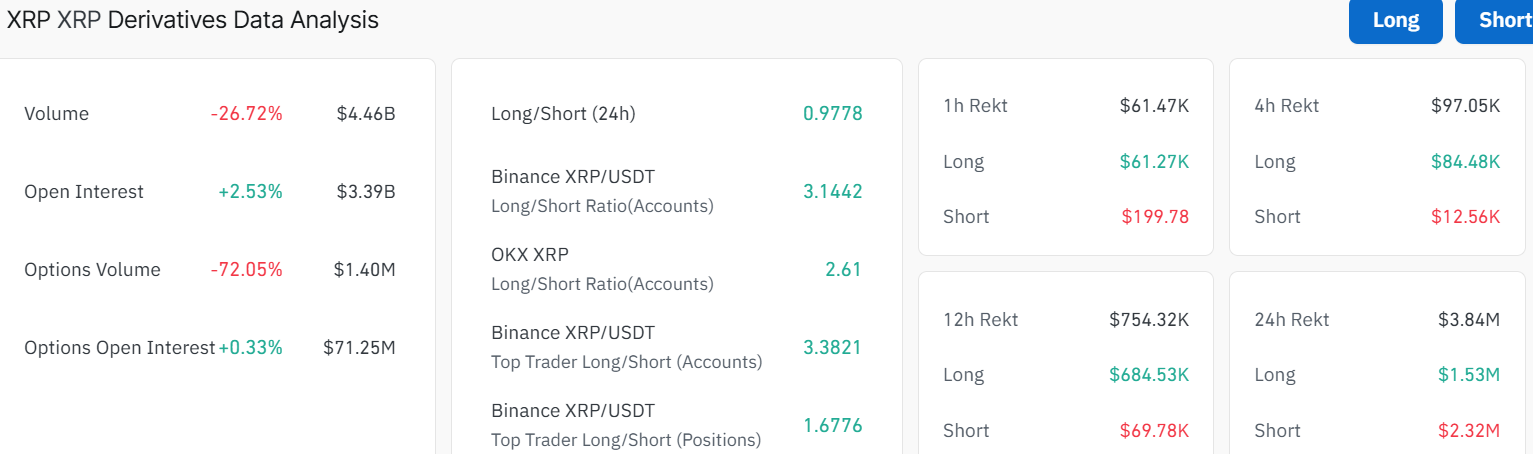 XRP Derivatives Data: CoinGlass
Meanwhile, the long-to-short ratio sits at 0.9778, indicating that the longs are paying the shorts. With the dwindling momentum in the crypto market, the bulls need strength to push the XRP price above $1.97 to resume an uptrend.
XRP Price Stalls Below $2 as Bears Eye $1.82 Support
The XRP price stalls below $2.00, currently exchanging hands at $1.88. The altcoin has been falling within a descending channel, with lower highs and lower lows. The 50‑day simple moving average is now falling near $1.97, while the 200‑day simple moving average hovers close to $2.54. XRP is trading below both SMAs, showing that the bears are having the upper hand. There have been several bounces, indicating that many long‑term holders view the current area as a value zone. However, a clean daily close below $1.82 would signal a deeper bearish phase.
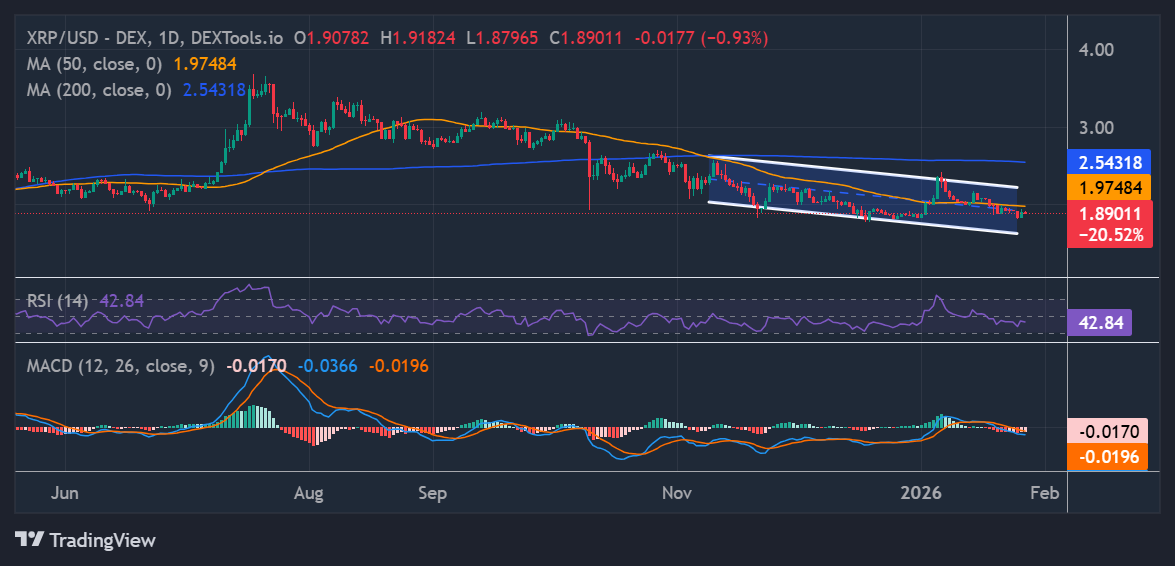 XRP/USD 1-day chart: TradingView
Momentum indicators lean cautiously as the RSI is sitting at 42.40. This indicates weak bullish strength but also leaves room for a relief rebound if the buyers step in. The MACD has crossed below the signal line and remains below the neutral territory. This further confirms that sellers still control the trend.
In the short term, if the XRP token loses support at $1.82, the next downside target could be near $1.77 lows tested in October. However, if the crypto market flips positive, the XRP bulls could attempt a recovery back toward initial resistance around the $1.97-$2.15 region. In the meantime, a close above the 50-day SMA level would be the first sign that the downtrend is ending.
eToro Platform
Best Crypto Exchange
- Over 90 top cryptos to trade
- Regulated by top-tier entities
- User-friendly trading app
- 30+ million users
eToro is a multi-asset investment platform. The value of your investments may go up or down. Your capital is at risk. Don’t invest unless you’re prepared to lose all the money you invest. This is a high-risk investment, and you should not expect to be protected if something goes wrong.
You May Also Like

Pi Network Targets Open Mainnet 2026, Millions Prepare as Utility and Migration Accelerate

Bitcoin Rainbow chart predicts BTC price for October 1, 2025

