Hyperliquid (HYPE) price went parabolic on Tuesday, driven by a surge in commodities trading volume on the platform. According to data from crypto.news, HyperliquidHyperliquid (HYPE) price went parabolic on Tuesday, driven by a surge in commodities trading volume on the platform. According to data from crypto.news, Hyperliquid

Here’s why Hyperliquid price rallied over 20% today

2026/01/27 18:08
4 min read

Hyperliquid (HYPE) price went parabolic on Tuesday, driven by a surge in commodities trading volume on the platform.

Summary
  • Hyperliquid price rose nearly 23% over the past day.
  • The rally was driven by a surge in commodities trading volume, especially Silver perpetual futures on the platform.
  • A confirmed falling wedge pattern signals more potential upside ahead.

According to data from crypto.news, Hyperliquid (HYPE) shot up 23% to nearly a three-week high of $27 on Tuesday afternoon Asian time. At this price, it remains 31% above its lowest point this week.

The major catalyst driving the HYPE price can be attributed to a rapid adoption of HIP-3, a major proposal that went live in mid-October last year. It allows anyone to launch perpetual futures contracts for a wide range of assets beyond typical cryptocurrencies, including commodities (gold and silver), US stocks, and indices, provided they have 500K HYPE staked on the network to deploy the contract.

In a Jan. 26 X post, the Hyperliquid team noted that open interest on the platforms running the upgrade had hit an all-time high of $790 million on Monday, a significant feat compared to the $260 million recorded just a month ago.

Commodities trading volume has surged on Hyperliquid as gold and silver take center stage, drawing in traders looking for a decentralized hedge against the current ‘risk-off’ global climate.

Even with a lackluster backdrop for major cryptocurrencies, Hyperliquid’s commodity offerings have created a distinct growth pocket, effectively insulated from the wider market malaise.

According to recent reports, the Silver (SILVER-USDC) contract has become one of the most active markets on the platform, ranking just behind Bitcoin (BTC) and Ether (ETH) in trading volume, with cumulative volumes nearing $1 billion.

Surges in Hyperliquid trading volume, particularly within HIP-3 markets like Silver, create a direct deflationary tailwind for the HYPE token via the protocol’s automated buyback and burn mechanism.

The platform funnels 97% of all trading fees (from both the original and new HIP-3 markets) into an Assistance Fund that automatically buys HYPE tokens on the open market. The network has repurchased tokens worth over $44 million in the last 30 days.

Furthermore, if these fees are paid in HYPE tokens, they are automatically burned, permanently reducing the supply. 

On top of this, as more perpetual contracts launch on the platform, more HYPE tokens are staked to meet the staking cap, which further reduces the total circulating supply.

Against this backdrop, whales have also started to accumulate HYPE. Data from analytics platform Onchain Lens shows that over $10 million in HYPE had exited exchanges over the past 24 hours, specifically via Galaxy Digital OTC transfers.

Hyperliquid price analysis

Hyperliquid price has broken out of a multi-month falling wedge pattern on the daily chart. A confirmed falling wedge pattern occurs when the price breaks from the upper trendline of the formation and is one of the most common bullish reversal signals in technical analysis.

Hyperliquid price has confirmed a falling wedge pattern on the daily chart.

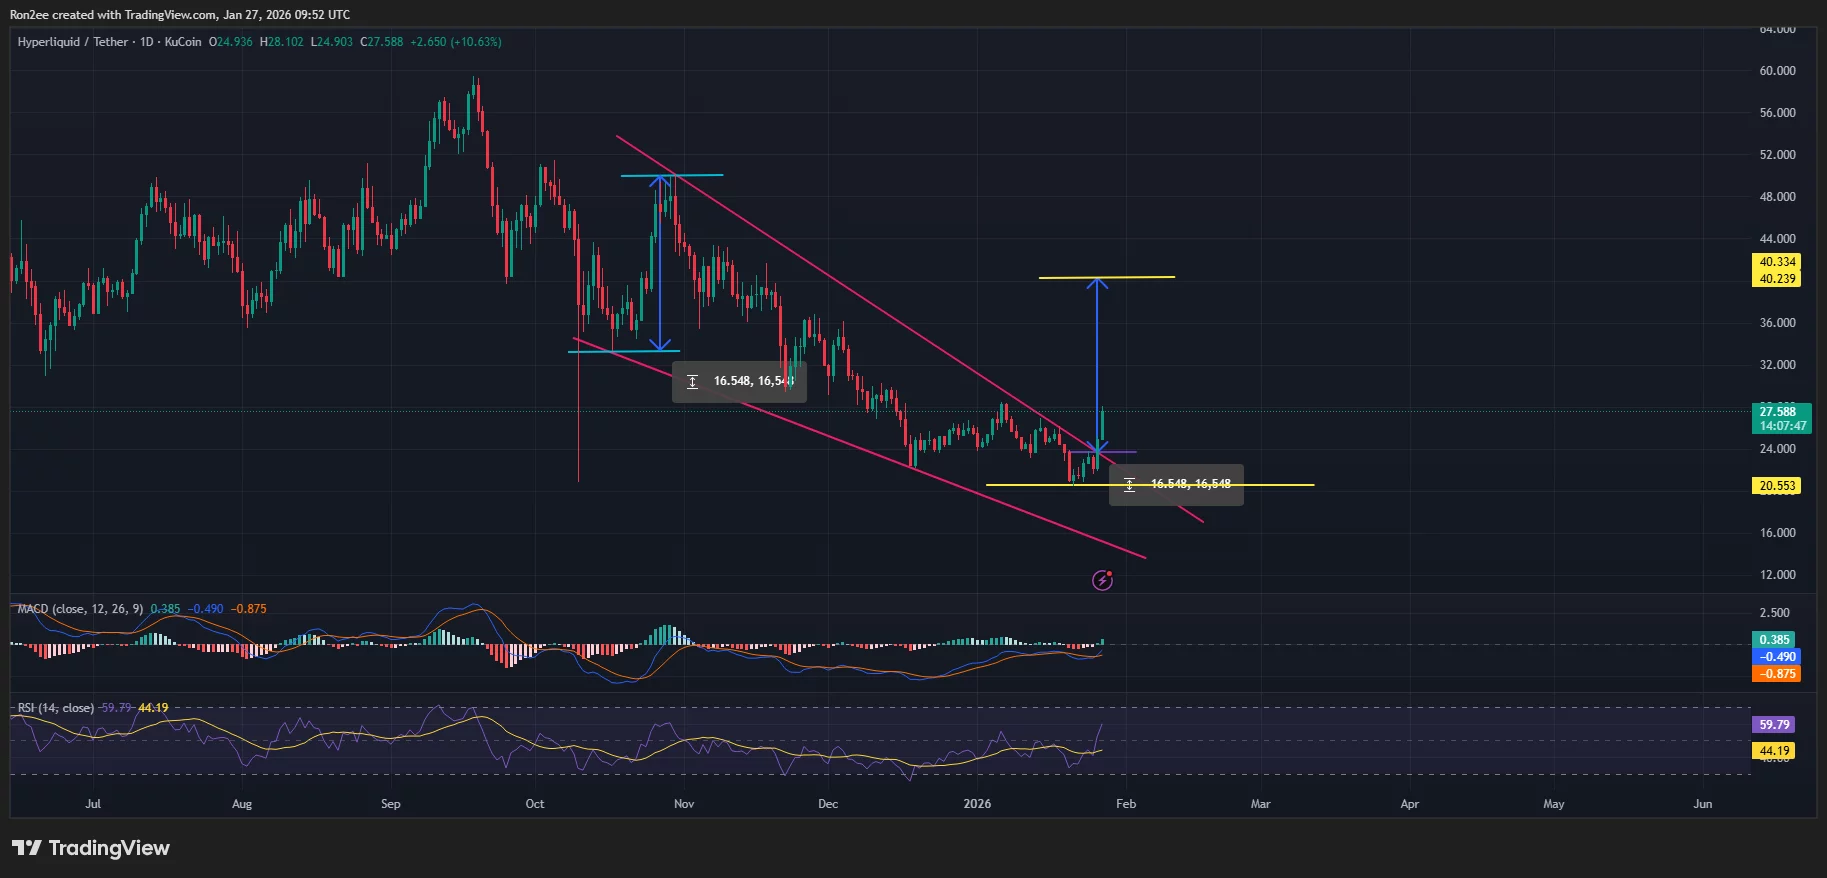
The MACD indicator had completed a bullish crossover, which is considered a common trend reversal signal. Simultaneously, the RSI has bounced off neutral levels to 60, which confirms renewed buyer interest while suggesting the rally has room for growth before hitting overbought territory.

Hence, HYPE price would likely continue to see sustained upside toward the $40 target. This level is calculated by projecting the height of the preceding pattern onto the breakout point. Notably, this target sits approximately 48% above current prices and converges with a major psychological resistance level.

On the contrary, a drop below last week’s low of $20 seen would invalidate the bullish forecast.

Disclosure: This article does not represent investment advice. The content and materials featured on this page are for educational purposes only.

Disclaimer: The articles reposted on this site are sourced from public platforms and are provided for informational purposes only. They do not necessarily reflect the views of MEXC. All rights remain with the original authors. If you believe any content infringes on third-party rights, please contact service@support.mexc.com for removal. MEXC makes no guarantees regarding the accuracy, completeness, or timeliness of the content and is not responsible for any actions taken based on the information provided. The content does not constitute financial, legal, or other professional advice, nor should it be considered a recommendation or endorsement by MEXC.

You May Also Like

Dramatic Spot Crypto ETF Outflows Rock US Market

Dramatic Spot Crypto ETF Outflows Rock US Market

BitcoinWorld Dramatic Spot Crypto ETF Outflows Rock US Market The cryptocurrency market is always buzzing with activity, and recent developments surrounding US spot Bitcoin and Ethereum ETFs have certainly grabbed attention. After a brief period of inflows, these prominent investment vehicles experienced a significant reversal, recording notable Spot Crypto ETF Outflows on September 22. This shift has sparked discussions among investors and analysts alike, prompting a closer look at what drove these movements and their potential implications for the broader digital asset landscape. What Triggered These Dramatic Spot Crypto ETF Outflows? On September 22, both US spot Bitcoin and Ethereum ETFs collectively observed net outflows, effectively ending a two-day streak of positive inflows. This sudden reversal indicates a potential shift in investor sentiment or market dynamics. Understanding the specifics of these Spot Crypto ETF Outflows is crucial for anyone tracking the pulse of the crypto market. Data from Trader T revealed that spot Bitcoin ETFs alone registered total net outflows amounting to $363.17 million. This substantial figure highlights a notable selling pressure across several key funds. Fidelity’s FBTC led the pack with $276.68 million in outflows. Ark Invest’s ARKB followed, seeing $52.30 million depart. Grayscale’s GBTC, a long-standing player, recorded $24.65 million in outflows. VanEck’s HODL also contributed with $9.54 million. Interestingly, BlackRock’s IBIT and several other funds reported zero flows on this particular day, indicating a concentrated selling activity in specific products rather than a market-wide exodus. How Did Ethereum ETFs Respond to the Spot Crypto ETF Outflows? The trend of net outflows wasn’t limited to Bitcoin. Spot Ethereum ETFs also faced considerable pressure, collectively experiencing $76.06 million in net outflows during the same period. This indicates a broader market sentiment affecting both major cryptocurrencies. Fidelity’s FETH accounted for $33.12 million of the outflows. Bitwise’s ETHW saw $22.30 million withdrawn. BlackRock’s ETHA registered $15.19 million in outflows. Grayscale’s Mini ETH contributed $5.45 million to the total. These figures underscore that while Bitcoin ETFs saw larger absolute outflows, Ethereum ETFs also experienced a significant cooling of investor interest. Such synchronized movements often suggest overarching market factors rather than isolated fund-specific issues. What Are the Broader Implications of These Spot Crypto ETF Outflows? The reversal from inflows to substantial Spot Crypto ETF Outflows could signal a few things. It might reflect profit-taking by investors after recent market rallies, or it could indicate a cautious stance due to macroeconomic uncertainties. Moreover, such movements can influence market sentiment, potentially leading to increased volatility in the short term. For investors, monitoring these ETF flows provides valuable insights into institutional and retail sentiment. Significant outflows can sometimes precede price corrections, offering an opportunity for strategic re-evaluation. Conversely, sustained inflows often suggest growing confidence in digital assets. It is important to remember that ETF flows are just one metric among many. A holistic view, considering on-chain data, macroeconomic indicators, and regulatory news, is essential for making informed decisions in the dynamic crypto space. These Spot Crypto ETF Outflows serve as a reminder of the market’s inherent volatility and the need for continuous vigilance. In summary, the recent dramatic Spot Crypto ETF Outflows from US Bitcoin and Ethereum funds mark a notable shift in the investment landscape. While a two-day inflow streak was broken, these movements are a natural part of a maturing market. They highlight the ebb and flow of investor confidence and the dynamic nature of digital asset investments. As the market continues to evolve, keeping a close eye on these ETF trends will remain crucial for understanding broader sentiment and potential future directions. Frequently Asked Questions (FAQs) Q1: What does “net outflows” mean for crypto ETFs? A1: Net outflows occur when investors redeem more shares from an ETF than they purchase, indicating more money is leaving the fund than entering it. Q2: Which US spot Bitcoin ETFs saw the largest outflows? A2: Fidelity’s FBTC led with $276.68 million in outflows, followed by Ark Invest’s ARKB and Grayscale’s GBTC, contributing significantly to the overall Spot Crypto ETF Outflows. Q3: Were Ethereum ETFs also affected by outflows? A3: Yes, US spot Ethereum ETFs experienced $76.06 million in net outflows, with Fidelity’s FETH and Bitwise’s ETHW being major contributors. Q4: What do these Spot Crypto ETF Outflows suggest about market sentiment? A4: They can suggest a shift towards profit-taking, increased caution due to macroeconomic factors, or a temporary cooling of investor interest in digital assets. Did you find this analysis of Spot Crypto ETF Outflows insightful? Share this article with your network on social media to help others understand the latest trends in the crypto ETF market and contribute to informed discussions! To learn more about the latest crypto market trends, explore our article on key developments shaping Bitcoin and Ethereum institutional adoption. This post Dramatic Spot Crypto ETF Outflows Rock US Market first appeared on BitcoinWorld.
Share
Coinstats2025/09/23 10:55
Remittix Success Leads To Rewarding Presale Investors With 300% Bonus – Here’s How To Get Involved

Remittix Success Leads To Rewarding Presale Investors With 300% Bonus – Here’s How To Get Involved

Besides its enormous presale success, Remittix is also extending a 300% bonus to early purchasers. This temporary bonus can be […] The post Remittix Success Leads
Share
Coindoo2026/02/07 16:39
Korean Crypto Exchange Bithumb Accidentally Gives Away Millions in Bitcoin During Promotion

Korean Crypto Exchange Bithumb Accidentally Gives Away Millions in Bitcoin During Promotion

TLDR Bithumb accidentally sent excess Bitcoin to customers during a promotional “Random Box” event in South Korea Some users reportedly received 2,000 BTC ($139
Share
Coincentral2026/02/07 16:39