

Caldera (CAL) Price Prediction 2026–2030: Can CAL Hit $0.560 Soon?
- Caldera shows early signs of recovery as price rebounds from lower Bollinger Band support, hinting at short-term bullish stabilization.
- RSI is trending upward above neutral levels, suggesting improving momentum without overbought conditions.
- Long-term structure remains constructive, though sustained upside requires a confirmed breakout above mid-range resistance.
Caldera (CAL) enters 2026 attempting to regain bullish structure after spending several weeks in a tight consolidation range on the daily timeframe. Price is currently trading near $0.223, rebounding from recent lows around $0.220, and showing early signs of renewed buyer interest.
The latest daily candle reflects a recovery move following a brief pullback, with price reclaiming the 20-day Simple Moving Average (SMA) near $0.212. This development suggests sellers are losing short-term control, opening the door for a potential continuation toward the upper Bollinger Band region if momentum holds. While Caldera has not yet confirmed a full trend reversal, the improving technical posture places it in a constructive position heading deeper into 2026.
Also Read: LINEA (LINEA) Price Prediction 2026–2030: Can LINEA Hit $0.01 Soon?
Market Context and Price Action
Caldera’s recent price behavior reflects a market transitioning from corrective pressure into stabilization. After rejecting lower Bollinger Band support near $0.192, buyers stepped in aggressively, pushing price back toward the center of the volatility range.
Volatility remains relatively compressed compared to prior expansion phases, indicating that Caldera is likely building energy for its next directional move. Whether this resolves higher or lower will depend on how price reacts at near-term resistance levels.
Current Market Overview
At the time of analysis, Caldera is trading around $0.223, holding above the Bollinger Band midline (20-day SMA) at $0.212. The upper Bollinger Band sits near $0.232, acting as immediate resistance.
This structure suggests CAL is currently in a neutral-to-bullish recovery phase, with buyers attempting to shift momentum in their favor. Sustained closes above the upper band would confirm renewed upside strength.
Technical Analysis
From a technical standpoint, Caldera is showing early recovery signals but remains within a broader consolidation structure. Momentum is improving, yet confirmation is still required before a sustained trend continuation can be assumed.
Bollinger Bands
The Bollinger Bands indicate a recent volatility contraction followed by a mild expansion attempt. Price bounced cleanly from the lower band near $0.1919, a technically healthy reaction that suggests downside exhaustion in the short term.
Currently, price is approaching the upper band near $0.2321. A decisive daily close above this level would signal volatility expansion to the upside and potentially trigger a momentum-driven move toward higher resistance zones. Failure to break above the upper band may result in continued sideways movement between $0.212–$0.232.
RSI Behavior
The Relative Strength Index (RSI 14) is currently around 56.6, trending above its signal average near 52.5. This placement reflects moderate bullish momentum, with neither overbought nor oversold conditions present.
An RSI push above 60 would strengthen the bullish case, while a drop back below 50 would indicate momentum weakening and raise the risk of renewed consolidation or retracement.
Support and Resistance Levels
From a structural analysis, Caldera’s immediate support is centered around the $0.212 level, which aligns with the Bollinger Band midline and acts as a key short-term pivot for trend stability. As long as price holds above this area, bullish recovery attempts remain technically valid. Below this, stronger downside support is located near $0.192, corresponding with the lower Bollinger Band and the most recent swing low, where buyers previously stepped in to halt selling pressure.
On the upside, Caldera faces initial resistance near $0.232, where the upper Bollinger Band currently caps price advances. This level represents the first major test for bulls attempting to expand volatility to the upside. Beyond that, the $0.250 zone stands out as a critical psychological and structural resistance area. A confirmed daily breakout above $0.250 would significantly strengthen Caldera’s medium-term outlook and could open the door to a broader bullish continuation phase.
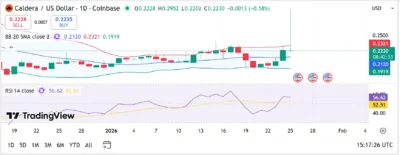
Source: Tradingview
Caldera Price Predictions (2026–2030)
| Year | Minimum Price | Average Price | Maximum Price |
| 2026 | $0.180 | $0.230 | $0.300 |
| 2027 | $0.210 | $0.280 | $0.360 |
| 2028 | $0.260 | $0.340 | $0.450 |
| 2029 | $0.310 | $0.420 | $0.560 |
| 2030 | $0.380 | $0.520 | $0.700 |
2026
In 2026, Caldera is expected to remain range-bound with periods of volatility expansion. If price holds above the $0.212 support zone, gradual upside continuation toward $0.300 remains possible during favorable market conditions.
2027
By 2027, improving market participation and stronger trend clarity could allow Caldera to establish higher lows. Sustained bullish structure may push average prices toward $0.280, with upside extensions toward $0.360 during strong cycles.
2028
Caldera could benefit from broader altcoin market expansion in 2028. With sufficient liquidity and momentum, price may trade comfortably above $0.300, targeting the $0.450 region during bullish phases.
2029
As the asset matures, volatility may stabilize while maintaining an upward bias. Strong accumulation zones could form above $0.310, allowing for advances toward $0.560 under favorable conditions.
2030
By 2030, Caldera’s long-term valuation will depend on ecosystem growth and market adoption. If development and demand align, CAL could enter a higher valuation phase, potentially trading above $0.700 during peak cycles.
Conclusion
Caldera enters 2026 in a technically improving position after successfully defending lower Bollinger Band support and reclaiming its mid-range moving average. While momentum remains moderate, rising RSI and stabilizing price action suggest buyers are gradually regaining control.
A confirmed breakout above $0.232–$0.250 would significantly strengthen the bullish outlook. Until then, Caldera is likely to continue building structure within its current range, setting the foundation for potential long-term expansion.
FAQs
1. What is the current market sentiment for Caldera in 2026?
Market sentiment is cautiously bullish, supported by improving momentum and a rebound from key support levels.
2. Is Caldera overbought right now?
No. RSI remains in neutral-bullish territory, suggesting room for further upside.
3. What levels must Caldera hold to stay bullish?
Holding above $0.212 is critical to maintaining short-term bullish structure.
4. What resistance should traders watch?
Immediate resistance lies near $0.232, with major resistance at $0.250.
5. What is Caldera’s long-term outlook?
If adoption and market conditions remain favorable, Caldera could continue appreciating through 2030 with higher cycle highs.
Also Read: Nomina (NOM) Price Prediction 2026–2030: Can NOM Hit $0.01 Soon?
The post Caldera (CAL) Price Prediction 2026–2030: Can CAL Hit $0.560 Soon? appeared first on 36Crypto.
You May Also Like

XRP Ignites As Spot Volume Skyrockets

Cloud mining is gaining popularity around the world. LgMining’s efficient cloud mining platform helps you easily deploy digital assets and lead a new wave of crypto wealth.
