Dogecoin (DOGE) Faces Turbulence After a 7% Slip: Can It Hold Key Support Zones?
- DOGE is holding within the $0.1270 zone.
- Dogecoin’s trading volume has exploded by 183%.
The market-wide bearish wave has triggered substantial losses across the crypto tokens. With all the digital assets charted in red, the bears could keep pushing prices lower. Meanwhile, the meme coin market cap has plunged by 7.5%. Alongside the market slide, Dogecoin (DOGE) has taken a hit, slipping steadily by over 7.41%.
The meme coin opened the day trading at a high of $0.1378, and later, with the bearish encounter, the Dogecoin price tumbled to a low of $0.1246. At press time, DOGE traded at $0.1270, and the trading volume has exploded by 183%, reaching $1.76 billion. Besides, the asset’s market has seen a 24-hour liquidation of $35.13 million.
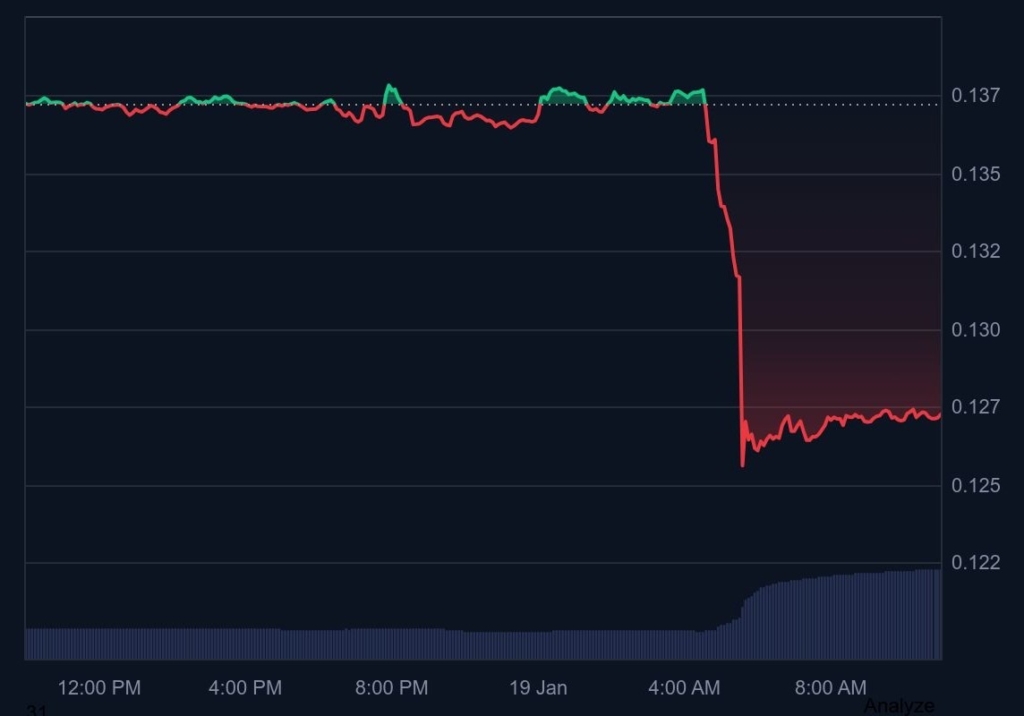 DOGE price (Source: CMC)
Zooming in on the 4-hour trading chart, the DOGE price is having a bearish pattern and might fall toward the support at $0.1256. Losing further momentum could strengthen the bears and likely send the price deeper into the correction territory below $0.1242.
Conversely, on the recovery side, the meme coin bulls might climb and attempt to reclaim the nearest resistance at the $0.1284 level. Gaining more traction could trigger the potential bulls to take command, driving the DOGE price toward $0.1298 or even higher.
Technical Indicators Point to Fading Momentum for DOGE
When both the Moving Average Convergence Divergence (MACD) line and the signal line of DOGE are positioned below the zero line, it indicates that bearish momentum is currently dominating. The asset is trading below its longer-term average, and if the lines start moving up, it hints at a trend shift.
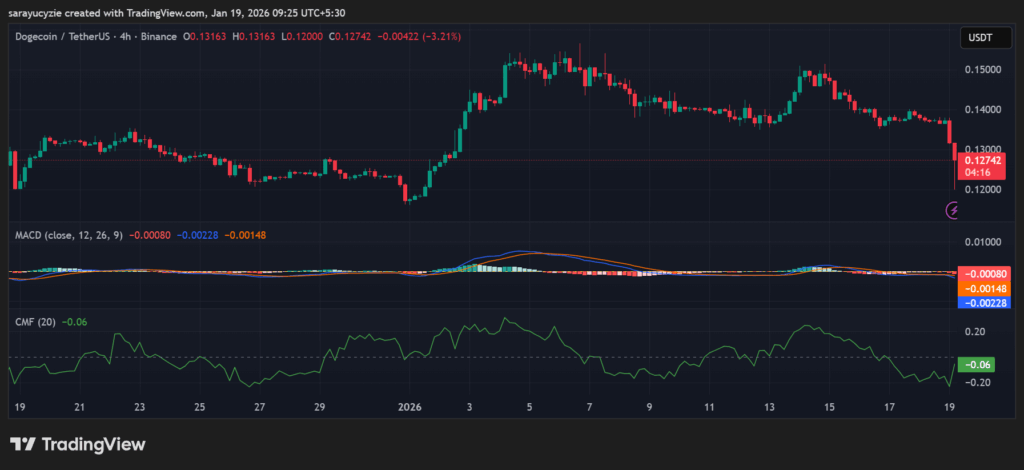 DOGE chart (Source: TradingView)
In addition, the Chaikin Money Flow (CMF) indicator of Dogecoin at -0.06 suggests a mild capital outflow from the asset. The selling pressure slightly outweighs the buying pressure in the market, showing weak demand. However, as it is close to zero, the trend is not strongly bearish and could alter.
DOGE’s Bull Bear Power (BBP) value of -0.01434 implies very weak bearish pressure. The sellers currently have a small upper hand, and as the reading is close to zero, the momentum is weak and a possible balance between bulls and bears. A drop lower would strengthen the bearish bias.
The daily Relative Strength Index (RSI) is found at 23.10, which signals that Dogecoin is deeply oversold. With the strong selling pressure, it can also point to a potential short-term rebound if the buyers step in. Notably, traders watch for divergences or a move above 30 to confirm recovery.
Top Updated Crypto News
Peter Thiel-Backed Bullish Files for US IPO as Crypto Listings Surge
You May Also Like

US Leads With $2.05B in Crypto Fund Inflows, CoinShares Reports

UK data may boost Sterling amid short squeeze – ING