XRP Ledger activity plunge reflects timing effects, not lasting network disruption Weekend liquidity gaps triggered sharp metric drops without damaging XRP LedgerXRP Ledger activity plunge reflects timing effects, not lasting network disruption Weekend liquidity gaps triggered sharp metric drops without damaging XRP Ledger

XRP Ledger Activity Crashes 99% in 48 Hours as Weekend Liquidity Vanishes

  • XRP Ledger activity plunge reflects timing effects, not lasting network disruption
  • Weekend liquidity gaps triggered sharp metric drops without damaging XRP Ledger fundamentals
  • Institutional flow pauses exaggerated activity data while XRP price structure stayed stable

At first glance, it seems disastrous to report that XRP Ledger activity fell by 99% in just 48 hours, yet the timing of the drop offers important clarification. According to market analysts monitoring on-chain data, the decline coincided with a typical weekend liquidity slowdown as institutional and enterprise participants paused operations.


XRP Ledger payment volumes rely heavily on concentrated flows rather than continuous retail usage, with market making, cross-border settlement testing, and institutional transfers driving activity. These flows do not occur evenly across the trading week, so when major participants step back over the weekend, reported activity can fall sharply without signaling distress.


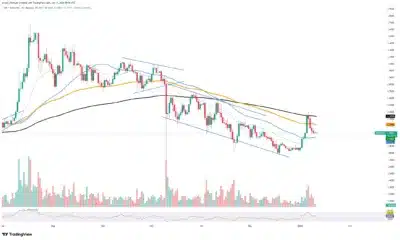
The calculation window influenced the severity of the reported decline because activity levels before the drop were elevated and exaggerated the percentage change. Price behavior reflected restraint instead of panic, with XRP holding above short-term support while facing resistance near longer-term exponential moving averages.


Volume trends reinforced that interpretation as trading volumes remained thin and irregular during low-liquidity weekend sessions.


Also Read: XRPL Sets 11.5M XRP Liquidity Target as DeFi Push Nears Critical Phase


Weekend liquidity gaps distort XRP Ledger activity data

According to analysts, shallow liquidity environments magnify on-chain metric changes, where modest participation shifts trigger large percentage swings. Such conditions often produce unreliable short-term signals, with false breakouts and sudden reversals emerging from thin order books. Historical patterns support this view, as XRP Ledger activity repeatedly rebounds once weekday trading and institutional flows resume.


XRP

Source:

Tradingview

Payments volume usually recovers before price action stabilizes, offering an early signal of renewed network participation. Market observers noted that sustained weakness into midweek sessions would raise concern, yet no continued inactivity has appeared so far.


The immediate risk centers on volatility rather than structural damage, since low liquidity exaggerates price movement in both directions. Despite dramatic headlines, underlying network operations remain unchanged, while participants monitor activity as normal trading conditions return.


The 99% decline in XRP Ledger activity reflects a temporary liquidity absence, with regular participation offering clearer insight into network strength.


Also Read: Crypto Questions Flood Russia’s Pension Hotline as Public Curiosity Outpaces Policy


The post XRP Ledger Activity Crashes 99% in 48 Hours as Weekend Liquidity Vanishes appeared first on 36Crypto.

Market Opportunity
XRP Logo
XRP Price(XRP)
$2.0492
$2.0492$2.0492
-1.93%
USD
XRP (XRP) Live Price Chart
Disclaimer: The articles reposted on this site are sourced from public platforms and are provided for informational purposes only. They do not necessarily reflect the views of MEXC. All rights remain with the original authors. If you believe any content infringes on third-party rights, please contact service@support.mexc.com for removal. MEXC makes no guarantees regarding the accuracy, completeness, or timeliness of the content and is not responsible for any actions taken based on the information provided. The content does not constitute financial, legal, or other professional advice, nor should it be considered a recommendation or endorsement by MEXC.

You May Also Like

SUI Surges From Consolidation, Buyers Regain Control Above $1.78

SUI Surges From Consolidation, Buyers Regain Control Above $1.78

SUI had a good start to 2026 after a long consolidation, finally breaking higher above pivotal support. On the 4-hour timeline, the coin transitioned from relative
Share
Tronweekly2026/01/12 18:05
Microsoft Corp. $MSFT blue box area offers a buying opportunity

Microsoft Corp. $MSFT blue box area offers a buying opportunity

The post Microsoft Corp. $MSFT blue box area offers a buying opportunity appeared on BitcoinEthereumNews.com. In today’s article, we’ll examine the recent performance of Microsoft Corp. ($MSFT) through the lens of Elliott Wave Theory. We’ll review how the rally from the April 07, 2025 low unfolded as a 5-wave impulse followed by a 3-swing correction (ABC) and discuss our forecast for the next move. Let’s dive into the structure and expectations for this stock. Five wave impulse structure + ABC + WXY correction $MSFT 8H Elliott Wave chart 9.04.2025 In the 8-hour Elliott Wave count from Sep 04, 2025, we saw that $MSFT completed a 5-wave impulsive cycle at red III. As expected, this initial wave prompted a pullback. We anticipated this pullback to unfold in 3 swings and find buyers in the equal legs area between $497.02 and $471.06 This setup aligns with a typical Elliott Wave correction pattern (ABC), in which the market pauses briefly before resuming its primary trend. $MSFT 8H Elliott Wave chart 7.14.2025 The update, 10 days later, shows the stock finding support from the equal legs area as predicted allowing traders to get risk free. The stock is expected to bounce towards 525 – 532 before deciding if the bounce is a connector or the next leg higher. A break into new ATHs will confirm the latter and can see it trade higher towards 570 – 593 area. Until then, traders should get risk free and protect their capital in case of a WXY double correction. Conclusion In conclusion, our Elliott Wave analysis of Microsoft Corp. ($MSFT) suggested that it remains supported against April 07, 2025 lows and bounce from the blue box area. In the meantime, keep an eye out for any corrective pullbacks that may offer entry opportunities. By applying Elliott Wave Theory, traders can better anticipate the structure of upcoming moves and enhance risk management in volatile markets. Source: https://www.fxstreet.com/news/microsoft-corp-msft-blue-box-area-offers-a-buying-opportunity-202509171323
Share
BitcoinEthereumNews2025/09/18 03:50
Trove ICO Rule Changes Allegedly Impact Trader Losses

Trove ICO Rule Changes Allegedly Impact Trader Losses

Allegations of modifications to Trove's ICO rules reportedly influenced significant market reactions, leading to notable trader losses and concerns about fairness
Share
coinlineup2026/01/12 18:44