

What If Bitcoin Hits $200K? AI Projects Dominance Spikes and Altcoin Frenzy
What would happen if Bitcoin reached $200,000? Nearly doubling its previous all-time high, a $200K price would move Bitcoin into a new tier of market capitalization, roughly matching the valuation of global blue-chip equities and sovereign debt holdings. It would likely attract new classes of capital and global media attention.
This article uses AI to analyze and explore that possibility through a structured framework. Instead of speculating on a date or treating the figure as inevitable, it investigates what could unfold if Bitcoin does reach this benchmark.
Drawing from prior market cycles and behavior patterns, it outlines key indicators investors might observe across dominance, altcoin behavior, sector reactions, macro drivers, and psychological sentiment.
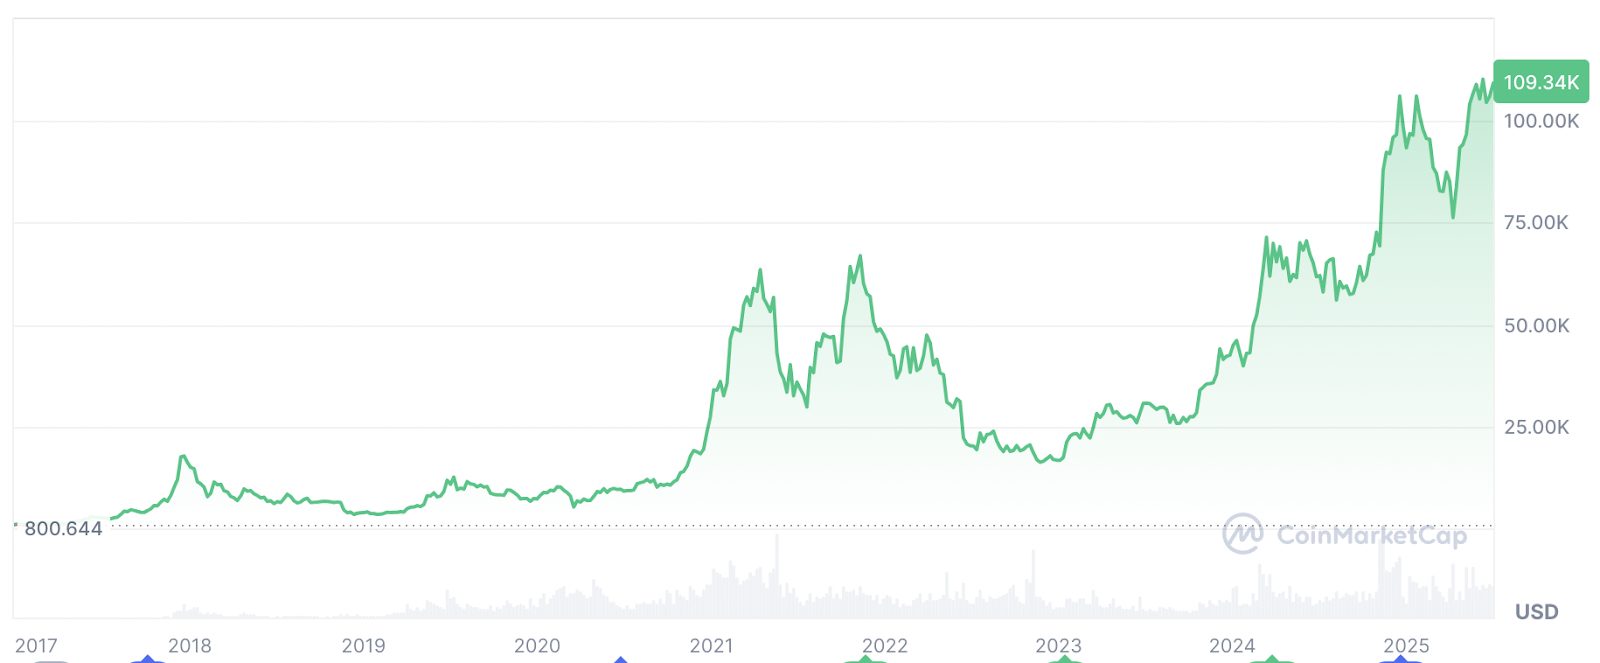
Bitcoin Price 2017-Present (Source: CoinMarketCap)
Rather than offering predictions, the goal is to map potential outcomes. The AI analysis considers how markets have responded to previous rallies and what those patterns might imply for a future where Bitcoin touches $200K.
Research Approach and Analytical Framework
To ground the analysis, we analyzed data from two previous bull cycles with ChatGPT’s o3 model—2017 and 2020 to 2021—using CoinMarketCap and TradingView. Both periods saw Bitcoin leading the initial price movements, followed by capital rotation into altcoins. BTC dominance rose early, then declined as other tokens gained traction.
This historical lens helps to frame a plausible path forward. AI analysis added structure by projecting how different segments might react under specific conditions. These include shifts in BTC dominance, ETH/BTC ratio trends, and short-term altcoin volatility following a price spike.
We assume Bitcoin reaches $200K in an environment that supports a higher risk appetite, such as post-ETF-approval inflows, macroeconomic easing, or a weakening dollar. No single catalyst is implied, but conditions would likely include strong institutional demand and favorable regulation.
Initial Shock: Bitcoin Dominance Spikes
If Bitcoin breaks through $200K, dominance is likely to climb in the early stages. In past cycles, this has indicated capital concentration in Bitcoin as investors seek security in the most liquid asset. In 2017, dominance fell from 64 percent to under 40 percent as the rally matured. In the 2021 cycle, it peaked around 73 percent before dropping below 50 percent once altcoins gathered momentum.

Bitcoin Dominance 2017-Present (Source: TradingView)
At the $200K level, Bitcoin would almost certainly attract institutional flows and dominate trading volumes. Search interest and media coverage would spike, even among retail investors who have stayed on the sidelines. Historically, these moments have been associated with a rapid inflow of attention and capital, setting the stage for short-lived overextension.
However, the rise in dominance might be temporary. Once BTC appears to stabilize at new highs, capital could begin rotating into ETH and eventually into smaller assets. This transition has occurred before, often within weeks of a Bitcoin top.
Altcoin Rotation: ETH Rebounds, Altseason Looms
Ethereum has historically underperformed during Bitcoin-led surges but tends to recover strongly once BTC momentum cools. During the late 2020 rally, ETH/BTC declined even as BTC rallied. But by mid-2021, Ethereum regained ground and outperformed Bitcoin in percentage terms for several months. The ETH/BTC ratio climbed steadily, indicating renewed confidence in broader crypto exposure.
Ethereum to Bitcoin Ratio 2017-Present (Source: TradingView)
Blockchaincenter’s Altcoin Season Index supports this. In both 2017 and 2021, altcoin rallies intensified once Bitcoin had already established a local high. In 2021, large-cap alts rose by over 170 percent compared to a relatively flat BTC.
Smaller tokens often lag further, but their moves are sharper once they catch up. If BTC reaches $200K and then stabilizes, the conditions for a classic altcoin season may emerge. Capital typically flows first to ETH, then to mid-cap tokens, and finally to microcaps as risk appetite increases.
Altcoin Season Index 2020-Present (Source: Blockchaincenter)
These transitions are fast and often unpredictable. Investors watching dominance metrics, ETH/BTC ratios, and liquidity conditions may spot the early signs of such a rotation.
Sector Reactions: DeFi, Memecoins, Metaverse
Beyond general altcoins, specific token sectors have often been the primary beneficiaries of late-cycle capital. In 2021, DeFi protocols, meme tokens, and metaverse-related assets surged once Bitcoin began to flatten out. These moves were amplified by social sentiment and community engagement rather than core utility.
Should Bitcoin reach $200K, speculative capital may again flow into these and other new, trending segments (AI, RWA, etc). Traders who missed the early BTC gains may chase higher beta assets, especially if short-term sentiment supports them. These rallies tend to be brief and steep, with heightened volatility on both the upside and downside.
Timing also matters. These sectors often peak just after Bitcoin tops. Watch for rising social engagement and increasing trading volume as early indicators.
Macro Tailwinds and Regulatory Catalysts
No major price level exists in a vacuum. A $200K Bitcoin would likely follow a set of favorable macro and regulatory developments. Additional ETF approvals could trigger new flows from wealth managers and pension funds. A weakening dollar or easing Fed stance might drive investors to reevaluate long-term stores of value, and persistent inflation could push more institutional interest into hard digital assets.
What drives the price also shapes what follows. An ETF-driven rally would likely keep most capital in Bitcoin and Ethereum. However, if broader macro recovery leads the charge—like a tech-stock rebound or real yield compression—then altcoins might benefit as well.
The nature of the catalyst would determine the breadth of participation. A narrow rally driven by institutions tends to favor high-liquidity assets. A wider rally, driven by retail and macro optimism, tends to pull in speculative names. The outcome is not just price-based but structural.
Understanding this would help investors anticipate where capital may flow next.
Mapping Reversal Risks and Volatility Ahead
In past cycles, dominance tends to peak around the time Bitcoin hits its top. When BTC hit $20K in December 2017, dominance fell shortly after. In 2021, BTC reached $69K while dominance was already declining, setting the stage for broad market retracements.
The scenario might look like this: Bitcoin touches $200K, dominance climbs to 60 percent, then retreats over several days as capital disperses. If this process unfolds too quickly, altcoin prices may rise and fall just as fast. Tokens with low liquidity or inflated valuations may see abrupt corrections.
The risk isn’t only that prices fall, but that the correction hits different sectors at different speeds. Bitcoin may remain steady while smaller tokens experience outsized drawdowns. Investors unfamiliar with this dynamic may misread the timing, entering too late or exiting too early.
Volatility often follows rapid rotations. Watching dominance trends and ETH/BTC shifts can help assess when momentum begins to fade.
Investor Sentiment Shifts—Retail vs Institutional
Retail behavior often mirrors price action. In 2017 and 2021, Google Trends data shows search interest for “Bitcoin” peaked near the market top. These periods were marked by media saturation and public curiosity.
Bitcoin Google Trend Index (Source: Google)
Recent rallies haven’t generated the same level of attention. Even with new highs, search volume remains well below prior peaks. If Bitcoin hits $200K under similar conditions, the move may be driven more by institutions than retail. This could delay broader participation, especially in altcoins.
A subdued retail environment might mute initial volatility, but it could also dampen follow-through in later phases. Altcoin seasons tend to rely on retail-driven liquidity. If that component is missing or delayed, smaller tokens may struggle to replicate past performance.
Still, attention can return quickly. If media focus intensifies, search trends could reverse rapidly. Retail engagement tends to follow headlines.
Preparing for a Potential $200K Bitcoin Market
As we’ve explored what might happen if Bitcoin reaches $200K, we’ve drawn from real-world data and historical behavior to outline potential developments across market structure, investor behavior, and asset rotation.
Key indicators to monitor include Bitcoin dominance, ETH/BTC ratio trends, and search activity. These offer insight into whether a rally is broadening, narrowing, or beginning to reverse.
Rather than make a prediction, this scenario helps map expectations. Understanding previous cycles doesn’t guarantee foresight, but it does offer useful context. If Bitcoin does approach $200K, preparation will matter more than precision.


You May Also Like

Metaplanet buys 5,075 Bitcoin in Q1 to become 3rd-largest treasury

FBI: Crypto Fraud Reaches $11 Billion


