The post Missed PEPE’s 1250% Rally? Analysts Say This Token Could Be the Next Top Crypto appeared first on Coinpedia Fintech News If you missed the massive run in Pepecoin (PEPE), you’re hardly alone. In April 2023 the viral meme coin took off and climbed more than 1,000% in a few months. But now many analysts believe it may be too late to capture a similar breakout. A new contender has emerged: Mutuum Finance (MUTM), a fresh …The post Missed PEPE’s 1250% Rally? Analysts Say This Token Could Be the Next Top Crypto appeared first on Coinpedia Fintech News If you missed the massive run in Pepecoin (PEPE), you’re hardly alone. In April 2023 the viral meme coin took off and climbed more than 1,000% in a few months. But now many analysts believe it may be too late to capture a similar breakout. A new contender has emerged: Mutuum Finance (MUTM), a fresh …

Missed PEPE’s 1250% Rally? Analysts Say This Token Could Be the Next Top Crypto

2025/11/04 21:11
4 min read
mutm-pepe

The post Missed PEPE’s 1250% Rally? Analysts Say This Token Could Be the Next Top Crypto appeared first on Coinpedia Fintech News

If you missed the massive run in Pepecoin (PEPE), you’re hardly alone. In April 2023 the viral meme coin took off and climbed more than 1,000% in a few months. But now many analysts believe it may be too late to capture a similar breakout. A new contender has emerged: Mutuum Finance (MUTM), a fresh entrant poised to draw attention in the next DeFi cycle.

Pepecoin (PEPE)

Pepecoin currently trades at around $0.000007, with a market cap of roughly $4 billion, based on a circulating supply of about 420 trillion tokens. While it still enjoys heavy social buzz and active trading, the technical picture suggests major resistance ahead.

trading-view

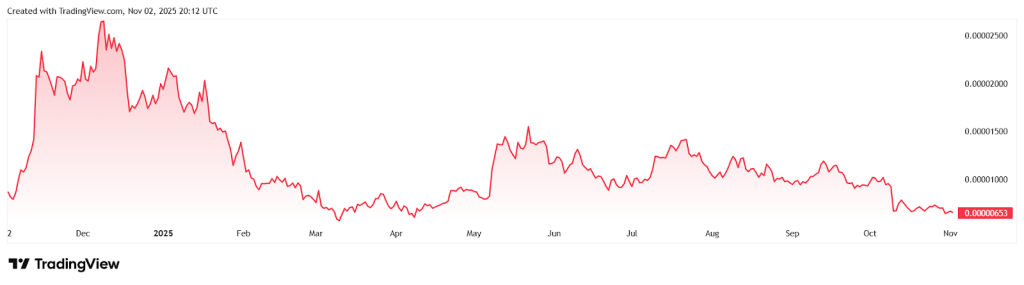
The coin is struggling to break past the $0.000011 to $0.000013 range, which had halted earlier rallies. If it fails to hold support near $0.000005, a sharp retracement could follow.

More importantly, PEPE’s limitation is structural. With such a massive supply and meme-driven structure, the upside is inherently capped. Analysts now view its best near-term scenario as reaching perhaps $0.000015 by mid 2026, a modest advance compared with what early-stage projects can offer.

Mutuum Finance (MUTM)

In contrast, Mutuum Finance is not a meme coin. It’s a new DeFi crypto building a decentralized lending and borrowing protocol. Users will be able to supply assets, earn yield via interest, or borrow against collateral, all through non-custodial smart contracts.

The project is currently in its presale (“Phase 6”), with tokens priced at $0.035. Earlier phases started at around $0.01, meaning early supporters already saw a surge of 250%. Next up: price rises to $0.04 in the following phase, then a confirmed launch price of $0.06.

Out of a total supply of 4 billion tokens, 45.5 % (1.82 billion) are allocated to the presale. So far approximately 790 million tokens have been sold, with around $18.4 million raised and over 18,000 holders already onboard. This rapid sell-through is a signal of momentum building.

Three Reasons MUTM Could Outperform PEPE

First, PEPE is already huge. With a multi-billion dollar market cap and massive supply, its potential for explosive percentage gains is limited. MUTM, by contrast, is still early — lower supply, lower visibility with much more room to grow.

Second, PEPE is fundamentally a meme. Its value depends on social trends and hype. Mutuum Finance brings utility: its lending protocol links activity to token demand. Depositors will receive yield-bearing tokens (mtTokens) and the platform uses a buy-and-distribute model that allocates protocol fees to purchase MUTM tokens for stakers. That feedback loop means token value is tied to use case, not just hype.

Third, timing matters. Many early PEPE investors are now hunting for the next crypto. With Mutuum Finance’s V1 protocol set to launch in Q4 2025, awareness is rising. The presale phase stage 6 is almost sold out, audit complete, payment by credit card enabled — all signs the project is moving from concept to execution.

Key Milestones That Matter

Mutuum Finance has completed a CertiK audit, scoring 90/100 in Token Scan, which adds credibility to its smart contract structure. A $50,000 bug bounty program also enhances security and community confidence. A 24-hour leaderboard rewards the top daily contributor with $500 worth of MUTM tokens, keeping participants engaged throughout the presale.

As Phase 6 nears completion, large whale allocations are reported, adding fuel to the FOMO engine. The upcoming jump to $0.04 and then $0.06 at launch gives early investors a clear upside roadmap, one that many say could deliver far more than what a mature token like PEPE can offer.

Missed the PEPE Train? MUTM Might Be the Next Stop

Pepecoin grabbed headlines and delivered huge returns for early adopters. But with its size, supply, and reliance on hype, repeating that outcome seems unlikely without a major rediscovery — and that’s hard to count on.

Mutuum Finance offers a different profile. It’s a new cryptocurrency in the DeFi space, leveraging utility, token-linked demand dynamics, and a structured presale engineered for early investors. The entry price is still low, the roadmap is clear, and the product launch is tangible. If Mutuum delivers on its vision, it could capture the upside that eluded late-stage meme coins.

For those who watched PEPE’s rise and missed the window, MUTM presents a chance to participate at ground level. Keep an eye on its V1 launch, whale flows, and presale completion. The next major DeFi breakout might still be under $0.05.

For more information about Mutuum Finance (MUTM) visit the links below:

Website: https://www.mutuum.com

Linktree: https://linktr.ee/mutuumfinance

Market Opportunity
Pepe Logo
Pepe Price(PEPE)
$0.000003692
$0.000003692$0.000003692
+0.21%
USD
Pepe (PEPE) Live Price Chart
Disclaimer: The articles reposted on this site are sourced from public platforms and are provided for informational purposes only. They do not necessarily reflect the views of MEXC. All rights remain with the original authors. If you believe any content infringes on third-party rights, please contact service@support.mexc.com for removal. MEXC makes no guarantees regarding the accuracy, completeness, or timeliness of the content and is not responsible for any actions taken based on the information provided. The content does not constitute financial, legal, or other professional advice, nor should it be considered a recommendation or endorsement by MEXC.

You May Also Like

Next Big Crypto? 11B Tokens Sold as APEMARS Stage 7 Closes in 24 Hours – Top 100x Meme Coin 2026 Poised to Outshine Cyber and Floki

Next Big Crypto? 11B Tokens Sold as APEMARS Stage 7 Closes in 24 Hours – Top 100x Meme Coin 2026 Poised to Outshine Cyber and Floki

The meme-coin market is attracting attention as investors search for the next big crypto! Cyber (CYBER) surged 6.93% amid rising trading volume, showing traders
Share
Coinstats2026/02/13 10:15
BlackRock Increases U.S. Stock Exposure Amid AI Surge

BlackRock Increases U.S. Stock Exposure Amid AI Surge

The post BlackRock Increases U.S. Stock Exposure Amid AI Surge appeared on BitcoinEthereumNews.com. Key Points: BlackRock significantly increased U.S. stock exposure. AI sector driven gains boost S&P 500 to historic highs. Shift may set a precedent for other major asset managers. BlackRock, the largest asset manager, significantly increased U.S. stock and AI sector exposure, adjusting its $185 billion investment portfolios, according to a recent investment outlook report.. This strategic shift signals strong confidence in U.S. market growth, driven by AI and anticipated Federal Reserve moves, influencing significant fund flows into BlackRock’s ETFs. The reallocation increases U.S. stocks by 2% while reducing holdings in international developed markets. BlackRock’s move reflects confidence in the U.S. stock market’s trajectory, driven by robust earnings and the anticipation of Federal Reserve rate cuts. As a result, billions of dollars have flowed into BlackRock’s ETFs following the portfolio adjustment. “Our increased allocation to U.S. stocks, particularly in the AI sector, is a testament to our confidence in the growth potential of these technologies.” — Larry Fink, CEO, BlackRock The financial markets have responded favorably to this adjustment. The S&P 500 Index recently reached a historic high this year, supported by AI-driven investment enthusiasm. BlackRock’s decision aligns with widespread market speculation on the Federal Reserve’s next moves, further amplifying investor interest and confidence. AI Surge Propels S&P 500 to Historic Highs At no other time in history has the S&P 500 seen such dramatic gains driven by a single sector as the recent surge spurred by AI investments in 2023. Experts suggest that the strategic increase in U.S. stock exposure by BlackRock may set a precedent for other major asset managers. Historically, shifts of this magnitude have influenced broader market behaviors as others follow suit. Market analysts point to the favorable economic environment and technological advancements that are propelling the AI sector’s momentum. The continued growth of AI technologies is…
Share
BitcoinEthereumNews2025/09/18 02:49
Bitcoin Rainbow chart predicts BTC price for October 1, 2025

Bitcoin Rainbow chart predicts BTC price for October 1, 2025

The post Bitcoin Rainbow chart predicts BTC price for October 1, 2025 appeared on BitcoinEthereumNews.com. The Bitcoin (BTC) Rainbow Chart has outlined potential price ranges for October 1, 2025, as the asset seeks to reclaim the $120,000 resistance. Throughout September, the maiden cryptocurrency has struggled to push past the $115,000 support zone. At press time, Bitcoin was trading at $115,950, up 0.15% in the past 24 hours and gaining a modest 0.5% over the past week. Bitcoin seven-day price chart. Source: Finbold Looking ahead to October 1, the Rainbow Chart projects that Bitcoin’s price could fall within a broad band of $36,628 to $409,726, depending on prevailing market sentiment. The Rainbow Chart, a long-term valuation model often used to track Bitcoin’s price cycles, is built as a logarithmic regression chart. It color-codes Bitcoin’s valuation bands, offering investors a simplified way to gauge whether the market is undervalued or overheated. Bitcoin price prediction  The lowest tier, labeled “Basically a Fire Sale,” spans from $36,628 to $47,947. Above that, the “BUY!” zone ranges from $47,947 to $64,777, while “Accumulate” covers $64,777 to $83,811. The “Still Cheap” band sets Bitcoin between $83,811 and $108,471, followed by the neutral “HODL!” zone at $108,471 to $142,332. Bitcoin Rainbow chart. Source: BlockhainCenter Cautionary levels emerge as prices climb higher. In this case, the “Is this a bubble?” range extends from $142,332 to $181,644, while “FOMO intensifies” lies between $181,644 and $233,215. On the other hand, the red zones, seen as overheated territory, start with “Sell. Seriously, SELL!” at $233,215 to $304,169 and peak with “Maximum Bubble Territory” from $304,169 to $409,726. With Bitcoin trading around $116,000 as of September 20, the Rainbow Chart suggests that by October 1, 2025, the asset will most likely fall within the “Still Cheap” or “HODL!” bands, implying a fair value between $83,811 and $142,332. This outlook indicates that despite Bitcoin’s strong gains, the model places…
Share
BitcoinEthereumNews2025/09/21 01:51