

Bitcoin price today: Fear Index at 22 as BTC clings to $62,852

As of July 9, 2026, the Bitcoin price today sits at $62,852, reflecting a fragile short-term recovery within a still-broken macro structure. The Fear & Greed Index at 22 signals extreme fear, while geopolitical tensions and institutional uncertainty continue to weigh on sentiment.
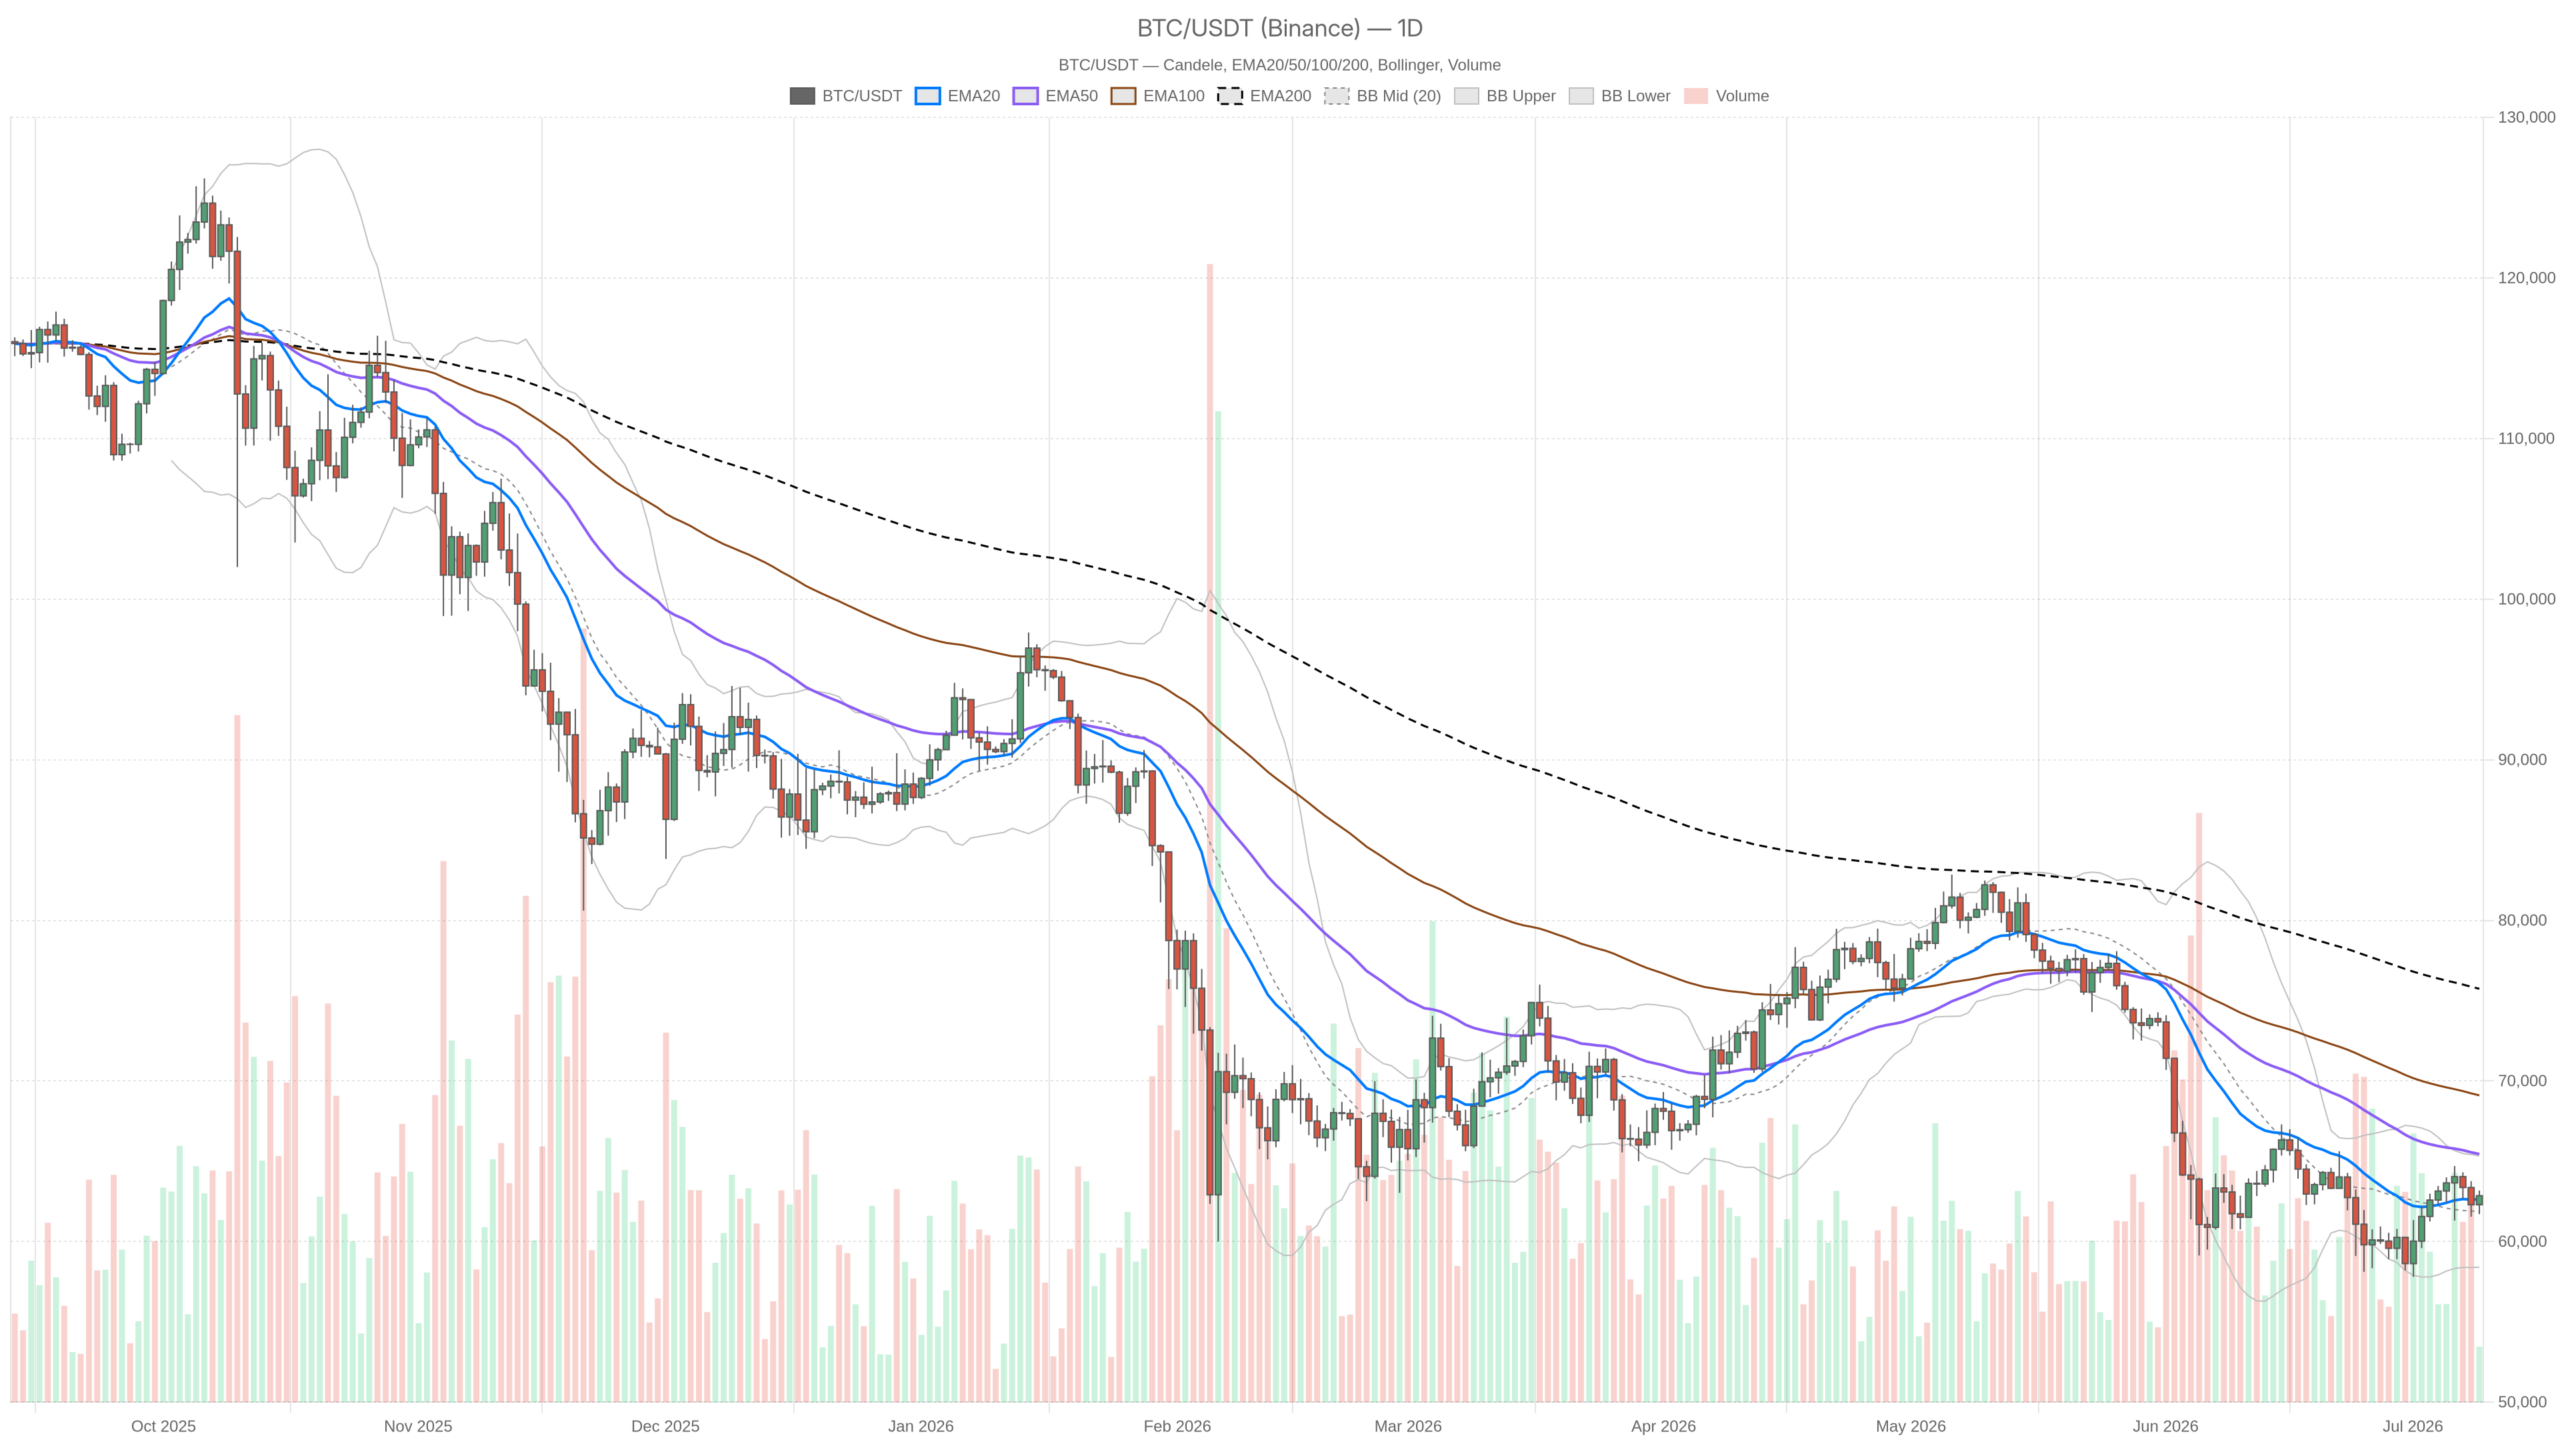 BTC/USDT — daily chart with candlesticks, EMA20/EMA50 and volume.
Key takeaways
- Bitcoin trades at $62,852 on July 9, 2026, stuck between a fragile short-term recovery and a broken daily structure.
- The Fear & Greed Index sits at 22 — deep in Extreme Fear territory — reflecting broad market anxiety.
- Daily RSI at 48.58 signals indecision, while the MACD histogram shows bearish momentum decelerating.
- Key resistance sits at $63,452 (daily R1) and $65,449 (EMA50); support rests at $61,979 (daily S1).
- Bitcoin dominance at 56.08% suggests capital is sheltering in BTC rather than flowing to altcoins.
A Market Holding Its Breath
Bitcoin is attempting a short-term recovery after weeks of structural damage, yet the macro picture remains firmly tilted to the downside. The dominant market force right now is not momentum or optimism — it is the slow, grinding weight of a broken trend trying to find a floor. Geopolitical noise and institutional uncertainty add pressure from the outside.
Adding to the pressure, fresh headlines from Bloomberg citing Trump’s remarks reigniting Iran war concerns, combined with Strategy‘s reported $216 million Bitcoin sale during an internal overhaul, have done nothing to inspire confidence. The macro regime is neutral at best, and the Fear & Greed Index at 22 tells you everything about sentiment.
Daily Timeframe: The Damage Is Still Visible
The daily chart tells a story of a market that fell hard and has not yet proven it can recover. Price trades above the EMA20 at $62,632 but remains significantly below the EMA50 at $65,449 — a gap that represents serious overhead resistance.
The EMA200 at $75,736 sits so far removed from current price that it almost feels like a different market. That distance signals how much ground Bitcoin has lost and how much work bulls would need to do before any structural recovery could be declared.
The daily RSI at 48.58 is the definition of no-man’s land — not oversold enough to trigger mean-reversion buying, not strong enough to confirm upward momentum. It signals that the market is undecided and big players are waiting rather than committing. Meanwhile, the MACD line at -647.52 is still negative, but the histogram printing at +563.81 is a genuine positive signal: bearish momentum is decelerating.
This divergence between a still-negative MACD line and a rising histogram is what technical analysts call a momentum shift in progress. It is not bullish yet, but it is less bearish than it was. Treat it as a yellow flag turning green, not a green light.
Bollinger Bands on the daily frame have price sitting between the midband ($61,866) and upper band ($65,333), confirming the near-term recovery attempt without suggesting any breakout. The ATR at $2,028 reminds traders that single-day swings of that magnitude are routine. Pivot analysis puts the daily PP at $62,578, with R1 at $63,452 and S1 at $61,979. Price above the pivot is mildly constructive, but R1 is close enough to be a near-term ceiling.
Hourly Timeframe: Short-Term Momentum Is Actually Positive
Stepping down to the 1-hour chart, the Bitcoin price today paints a more constructive picture — though only in relative terms. Price at $62,874 is cleanly above all three EMAs: the EMA20 at $62,388, EMA50 at $62,612, and EMA200 at $62,188. That alignment is bullish and represents a healthy short-term trend structure.
The hourly RSI at 58.83 has room to run before hitting overbought territory. The MACD histogram at +136.57 confirms that buyers have control at this timeframe. Crucially, the MACD line at -15.95 is nearly crossing the signal line at -152.51 — a cross here would be a short-term bullish trigger.
The hourly Bollinger Bands tell an interesting story: price has poked above the upper band at $62,832, which typically invites a brief consolidation or pullback. The hourly pivot PP is at $62,946 — just above current price — meaning the immediate overhead level is being tested right now. S1 at $62,715 provides the first layer of support if buyers lose conviction. The tension here is real: short-term momentum is clearly positive, but the daily structure is still damaged.
15-Minute Context: Execution Zone for the Patient
The 15-minute chart is purely execution territory, not where the thesis lives. That said, the RSI at 66.91 is approaching overbought — not there yet, but close enough that chasing entries here carries poor risk-reward. The MACD is firmly positive with a histogram of +73.34, confirming intraday upward pressure. However, the short-term overbought condition argues for patience: wait for a pullback toward the 1H S1 level rather than buying into near-term heat.
The Macro Context: Dominance, Sentiment, and Structural Headwinds
Bitcoin dominance at 56.08% is notable. Moreover, when BTC dominates at these levels during a period of fear, it typically means capital is sheltering in Bitcoin rather than flowing into altcoins. That is not bullish for the broader market, but it does suggest BTC is the last line of defense for crypto portfolios right now.
Total crypto market cap stands at approximately $2.24 trillion according to CoinGecko figures, with a 24-hour change that is essentially flat at +0.00027%. The market is barely moving at the macro level despite the short-term technical recovery attempt.
The Trump Bitcoin Reserve story adds political complexity. Bloomberg reported that the reserve initiative is facing internal friction as departments compete for control — this is the kind of institutional ambiguity that markets hate. Furthermore, the geopolitical risk premium being priced in around Iran-related headlines means the fundamental backdrop does not support aggressive risk-taking right now.
Two Scenarios, Both Conditional
The bullish case requires Bitcoin to clear and hold above the daily R1 at $63,452 with conviction, followed by a sustained push through the EMA50 at $65,449. If hourly momentum continues to build and the MACD line crosses positive on the 1H, that sequence becomes plausible. The daily MACD histogram turning more positive each session would confirm that the worst of the bearish momentum is behind us.
The bearish case is simpler and more aligned with the dominant daily structure. If price fails at the hourly PP ($62,946) and rolls over through the daily pivot at $62,578, the next meaningful support is the daily S1 at $61,979, followed by the Bollinger lower band at $58,400. A break of $61,979 on a daily close would confirm that the recovery attempt has failed. With an ATR of over $2,000 per day, that move could unfold quickly.
Positioning in a No-Man’s Land Market
The honest read here is that Bitcoin is in a contested zone where neither bulls nor bears have a clean edge on the daily chart. The short-term signals are constructive, but they exist within a macro structure that is still broken above $65,000. Volatility remains elevated — an ATR north of $2,000 means price can erase an apparent trend in a single session. Anyone operating in this environment should size conservatively, respect clear invalidation levels, and avoid extrapolating the hourly recovery into a daily thesis. The market is not yet telling a new bullish story — it is telling a story about whether the old bearish one is finally exhausted.
FAQ
What is the current Bitcoin price?
As of July 9, 2026, Bitcoin trades at $62,852, reflecting a fragile short-term recovery within a macro structure that remains broken above $65,000.
Why is the Fear & Greed Index important for Bitcoin traders?
The Fear & Greed Index at 22 indicates extreme fear in the market. When sentiment reaches these levels, it often signals that selling pressure may be exhausted, though it does not guarantee an immediate reversal.
Is Bitcoin’s current momentum bullish or bearish?
The hourly chart shows positive short-term momentum with price above all three key EMAs and an RSI of 58.83. However, the daily chart remains damaged, with price well below the EMA50 at $65,449, creating conflicting signals across timeframes.
What are the most important support and resistance levels right now?
Immediate resistance sits at $63,452 (daily R1), followed by the EMA50 at $65,449. Key support levels are $61,979 (daily S1) and the Bollinger lower band at $58,400.
Disclaimer: This article is for informational purposes only and does not constitute financial advice, an investment recommendation, or a solicitation to buy or sell any financial instrument or cryptocurrency. The analysis provided is not indicative of future results. Investing in crypto assets and financial markets carries a high risk of capital loss. Always do your own research (DYOR) and consult a qualified financial advisor before making any decision.
Article produced with the assistance of artificial intelligence and reviewed by the editorial team.


You May Also Like

Unleashing A New Era Of Seller Empowerment

PHL new upper-middle-income status should spur human capital investments – CPD, UNFPA

StakeStone (STO) Rockets 125%: What $981M Trading Volume Reveals



