

BTC/USDT Spot CVD Chart Analysis: Volume Heatmap and Order Flow Insights at 10:00 a.m. UTC
BitcoinWorld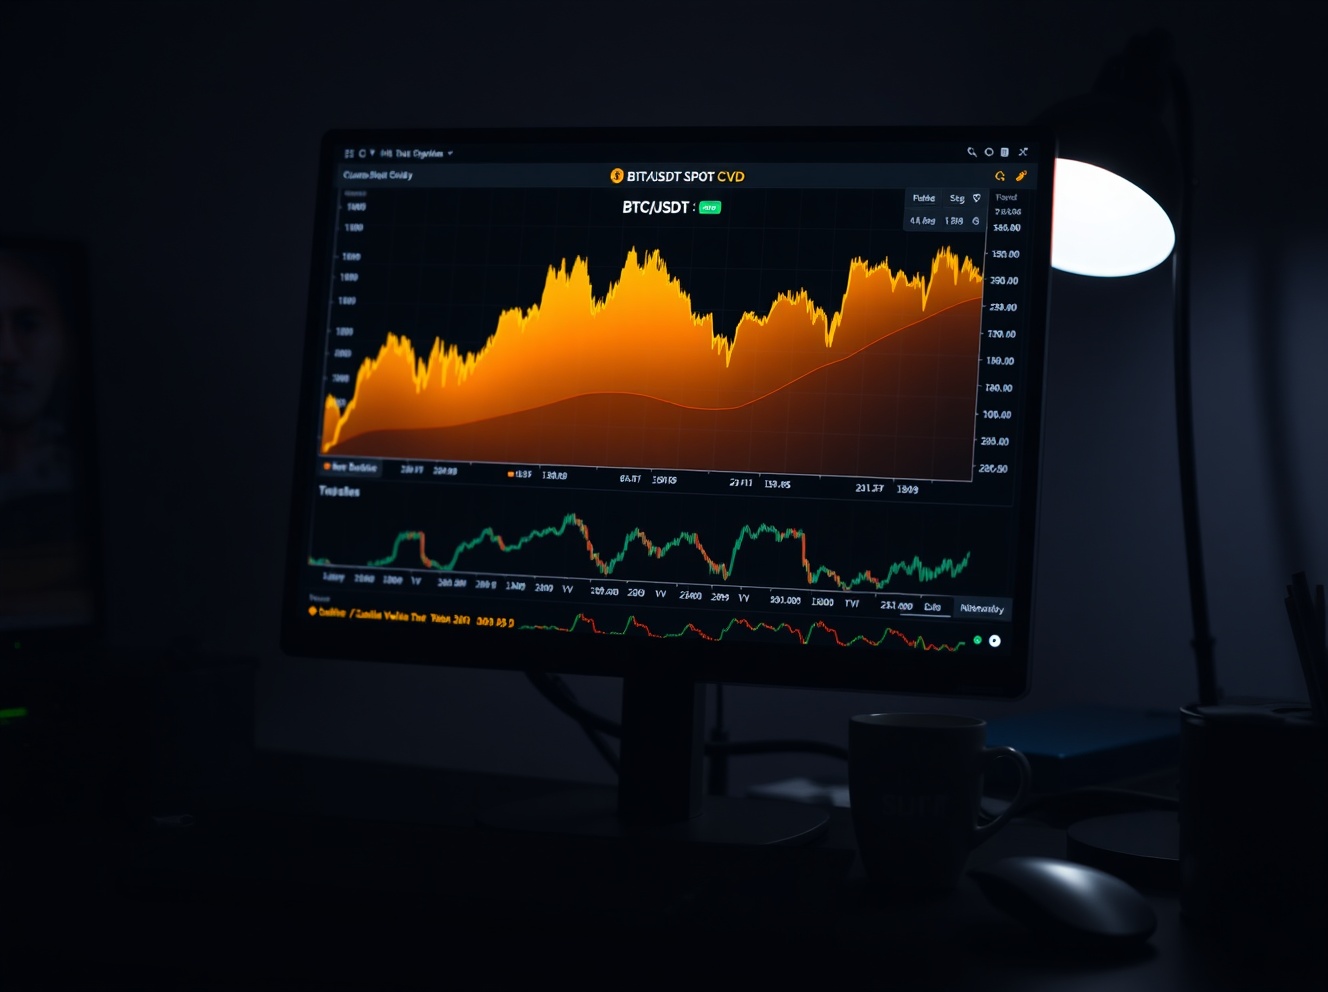
BTC/USDT Spot CVD Chart Analysis: Volume Heatmap and Order Flow Insights at 10:00 a.m. UTC
At 10:00 a.m. UTC, the BTC/USDT spot Cumulative Volume Delta (CVD) chart offers traders a detailed view of order book dynamics, combining a volume heatmap with granular order flow data. This analysis helps identify key support and resistance levels based on actual trading activity rather than price alone.
Understanding the Volume Heatmap
The upper section of the chart displays a Volume Heatmap, which tracks the scale of trading volume at specific price levels. When the price remains in a particular range for an extended period or experiences a significant move, the background color brightens. These brighter-colored areas historically act as support or resistance zones, as they represent price levels where substantial trading activity has occurred. Traders watch these zones closely for potential reversals or breakouts.
Cumulative Volume Delta (CVD) by Order Size
The lower section of the chart presents the CVD indicator, which categorizes buy and sell orders by the size of the funds involved. As buy orders increase, the line for the corresponding color rises. For example, the yellow line represents orders between $100 and $1,000, while the brown line indicates large orders between $1 million and $10 million. This breakdown allows traders to see whether retail or institutional players are driving the market at any given time.
What the Data Reveals
At the time of observation, the CVD lines show distinct patterns. The smaller order sizes (yellow and light blue lines) appear relatively flat, suggesting limited retail participation. In contrast, the larger order sizes (brown and dark blue lines) show more pronounced movement, indicating that institutional or high-net-worth traders are actively positioning. This divergence can signal a shift in market sentiment or preparation for a larger price move.
Why This Matters for Traders
The combination of the volume heatmap and CVD data provides a more complete picture of market structure. By identifying where large players are placing orders and where volume clusters have formed, traders can better anticipate potential price reactions. This approach moves beyond simple price analysis and incorporates actual order flow, offering a deeper understanding of supply and demand dynamics in the BTC/USDT spot market.
Conclusion
The BTC/USDT spot CVD chart at 10:00 a.m. UTC highlights the value of order flow analysis in cryptocurrency trading. With the volume heatmap indicating key support and resistance levels and the CVD revealing institutional activity, traders have actionable data to inform their strategies. As always, these indicators should be used in conjunction with other tools and risk management practices.
FAQs
Q1: What is the Cumulative Volume Delta (CVD) indicator?
The CVD indicator measures the difference between buying and selling volume in real time, categorized by order size. It helps traders see whether aggressive buying or selling is occurring at current price levels.
Q2: How does the volume heatmap identify support and resistance?
The heatmap brightens in price zones where high trading volume has occurred. These areas often act as support (when price falls to them) or resistance (when price rises to them) because traders remember these levels and place orders accordingly.
Q3: Why is it important to track order sizes in CVD?
Different order sizes reveal the type of market participant driving price action. Small orders suggest retail activity, while large orders indicate institutional involvement. Tracking these can help traders anticipate market moves before they happen.
This post BTC/USDT Spot CVD Chart Analysis: Volume Heatmap and Order Flow Insights at 10:00 a.m. UTC first appeared on BitcoinWorld.


You May Also Like

OpenVPP accused of falsely advertising cooperation with the US government; SEC commissioner clarifies no involvement

Robotics Automation Prototyping: Engineering Kinetic Agility into End-Effectors
This is One of The Best AI Stocks to Own In 2026



