

Solana (SOL) Defies Market Trends with $5.75M ETF Inflows and Billion-Transaction Milestone
Key Highlights
- SOL declined 1.7% but maintained stability above critical support zones as BTC and ETH ETFs experienced capital withdrawals
- Spot Solana ETFs in the United States attracted $5.75 million in net capital during this timeframe
- Non-vote transaction volume exceeded 1 billion on a weekly basis, marking a historic first for the network
- Active wallet addresses jumped from 16.8 million to 29.7 million over a 14-day period
- The network claimed the top position among all Layer 1 and Layer 2 platforms for decentralized application revenue and DEX trading volume
Solana (SOL) experienced a 1.7% decline, settling near the $79–$80 range throughout the most recent tracking period, mirroring Bitcoin’s 1.65% downturn. The broader cryptocurrency market capitalization contracted 1.47% to reach $2.14 trillion. However, SOL successfully defended critical support thresholds despite the downward pressure.
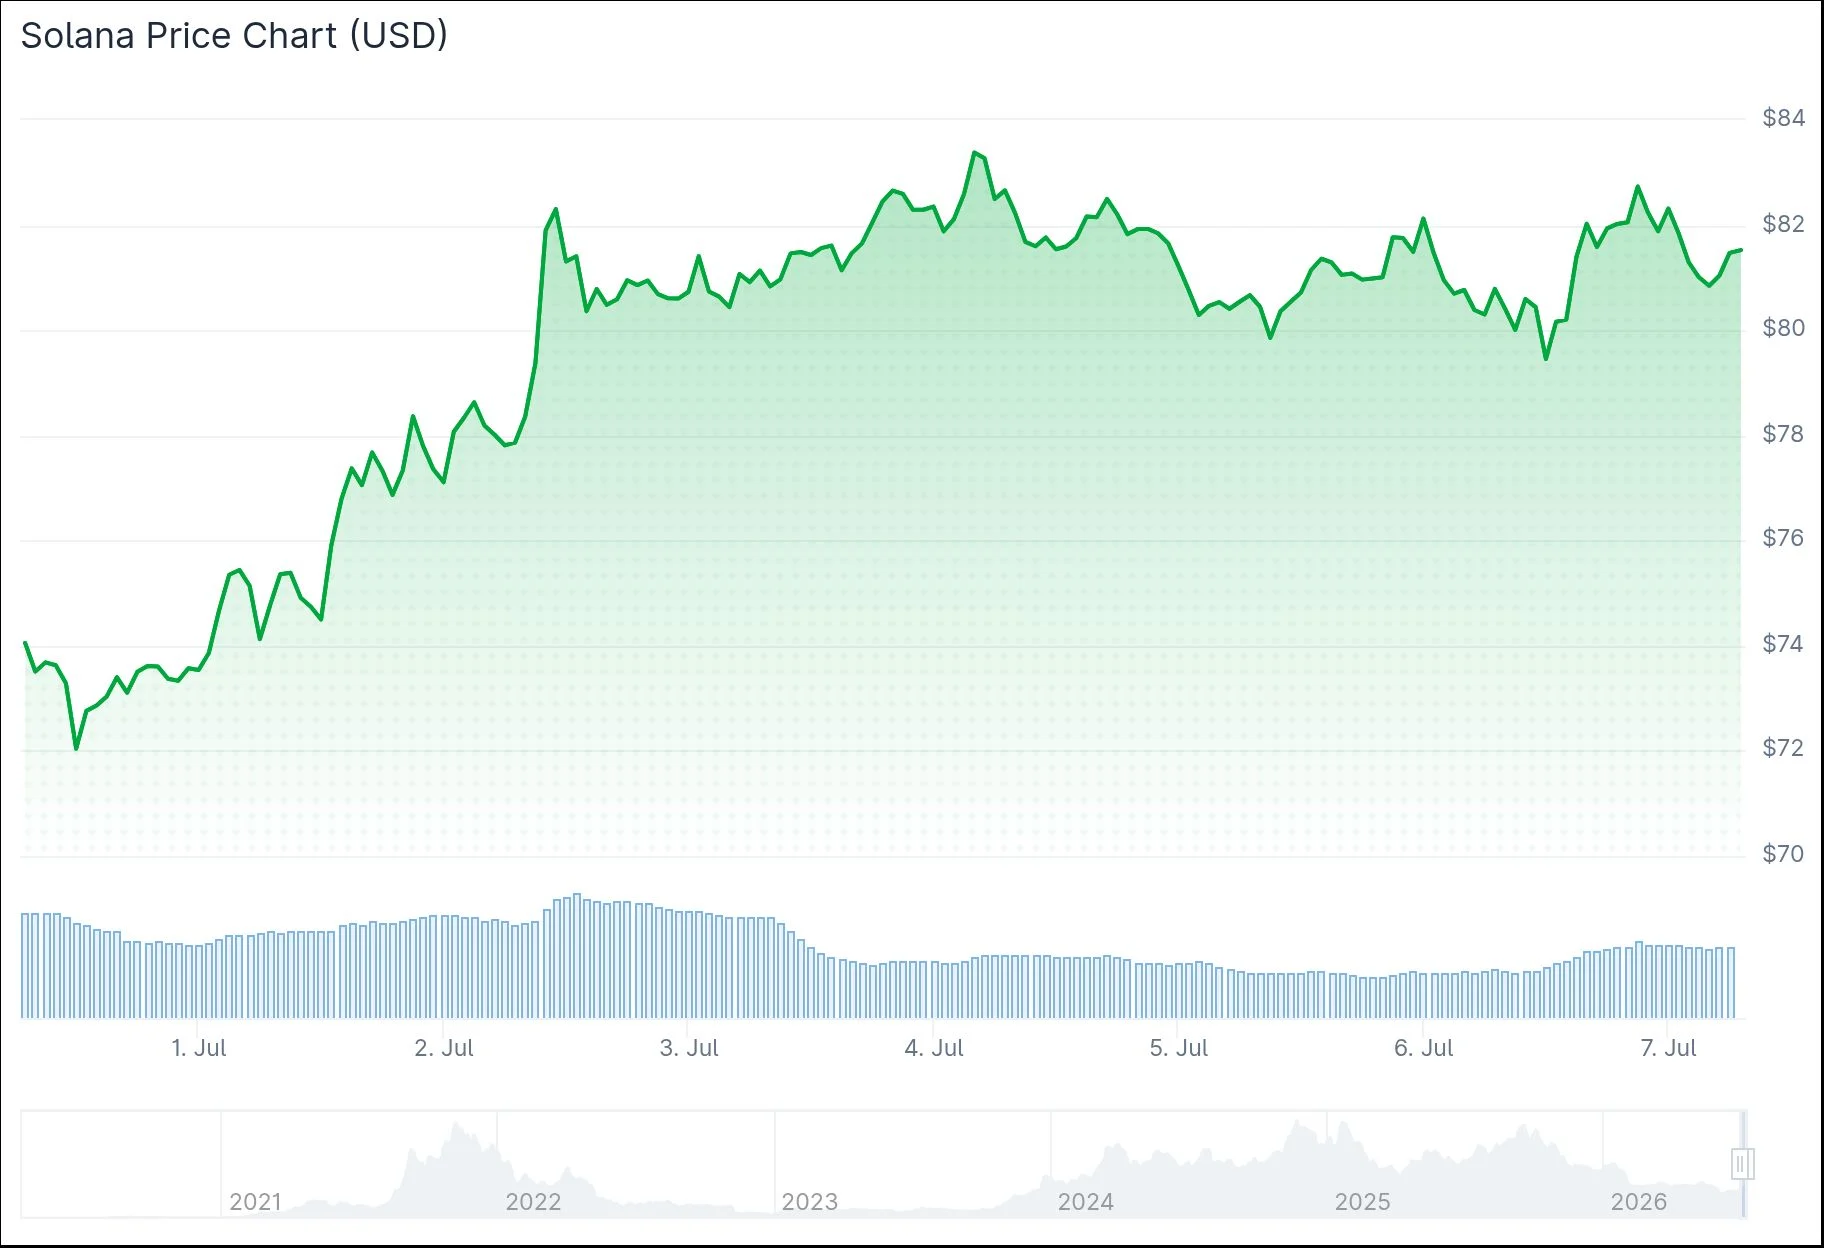 Solana (SOL) Price
The digital asset remains approximately 73% beneath its record peak of $294.33, achieved on January 19, 2025.
The notable development this week centered on Solana’s contrasting ETF performance relative to broader market trends. Spot Bitcoin ETF products registered $527 million in net capital outflows from June 29 through July 2 — marking their eighth consecutive week of redemptions. Spot Ethereum ETF vehicles shed $13.67 million over the identical period.
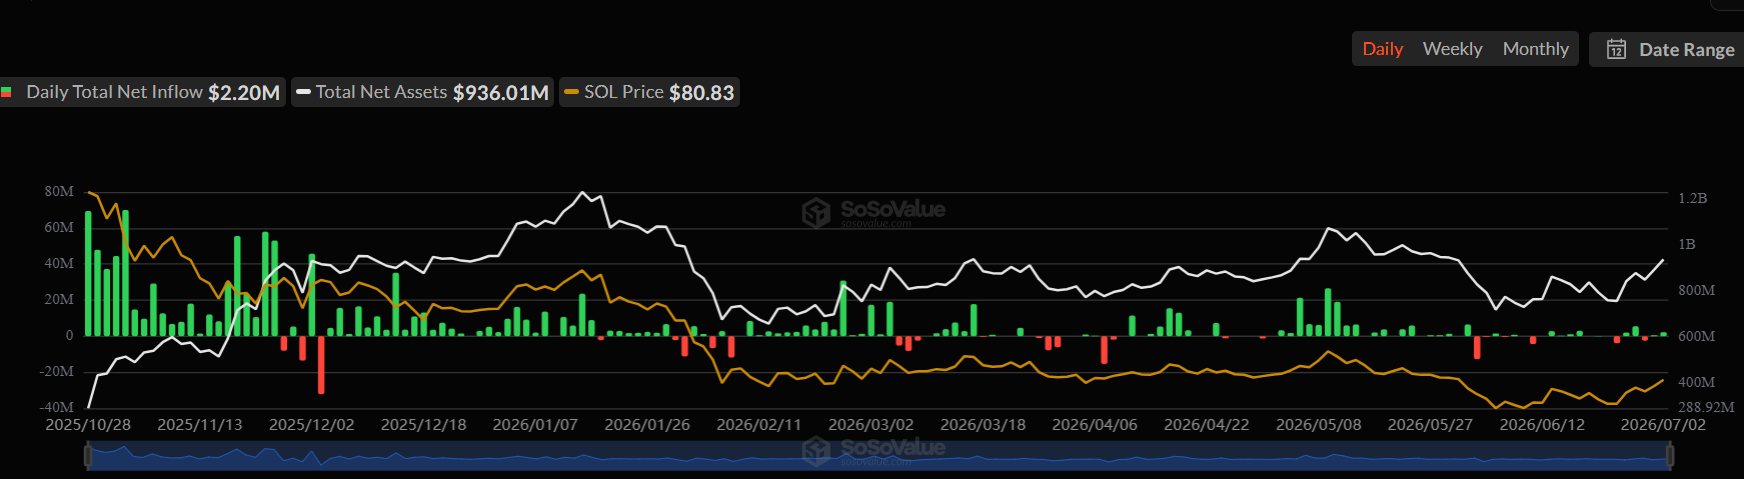 Source: SoSoValue
Solana demonstrated opposite momentum. U.S.-listed spot SOL ETF products captured $5.75 million in net capital inflows. XRP ETF vehicles accumulated $17.19 million, while HYPE ETF products gathered $4.32 million.
Network Metrics Reach Unprecedented Levels
Blockchain utilization achieved a groundbreaking benchmark during the previous week. SolanaFloor validated that weekly non-vote transaction counts surpassed one billion for the first occasion in the network’s existence. These transactions represent authentic user engagement, application interactions, and trading operations — excluding validator consensus votes — establishing this as a significant indicator of legitimate network activity.
Crypto analyst Michaël van de Poppe provided commentary on Solana’s technical positioning. He indicated the fundamental thesis for $SOL remains consistent — the asset is re-entering its trading range with expectations for minor retracement before upward momentum resumes. He emphasized the importance of maintaining $75–$77 as foundational support, suggesting that successful defense of these levels could propel movement toward $100 and potentially $120 throughout the upcoming weeks and months.
Active wallet addresses experienced dramatic expansion, ascending from 16.8 million to 29.7 million within a two-week window — representing approximately 76.8% growth. Solana additionally secured first-place rankings among all Layer 1 and Layer 2 blockchain platforms for both 24-hour and seven-day decentralized application revenue metrics, while commanding DEX volume leadership across matching timeframes. Polygon, Ethereum, Base, BNB Chain, and Hyperliquid trailed behind.
Technical Analysis Shows Consolidation Between Key Levels
Regarding trading activity, Solana secured second-place globally for the consecutive second week, facilitating $12.25 billion across centralized and decentralized exchange platforms. This performance exceeded Bybit’s $10.57 billion, although Binance maintained overall market leadership.
Examining the daily timeframe, SOL trades above its 20-, 50-, and 100-day moving average indicators. The MACD histogram sustains bullish positioning, despite momentum cooling following the previous week’s 15% advance.
The RSI indicator on the four-hour timeframe registered readings near 51–53, reflecting neutral directional momentum. The Supertrend indicator positioned below current price action around $78.30. Near-term resistance clusters approximately at $84–$85, whereas support structures at $78 and $76 represent critical monitoring zones.
The most recent trading price at publication time measured approximately $80.34.
The post Solana (SOL) Defies Market Trends with $5.75M ETF Inflows and Billion-Transaction Milestone appeared first on Blockonomi.


You May Also Like

OpenVPP accused of falsely advertising cooperation with the US government; SEC commissioner clarifies no involvement

Robotics Automation Prototyping: Engineering Kinetic Agility into End-Effectors
This is One of The Best AI Stocks to Own In 2026



