Bloom Energy Stock Surged 1,000% in a Year. The $25B Test Is Next

Bloom Energy stock surged past $302 after Brookfield expanded its AI infrastructure financing framework to $25 billion, a fivefold increase from the original $5 billion commitment. The daily trend is clearly bullish, but extreme medium-term gains and a stretched valuation backdrop warrant measured positioning.
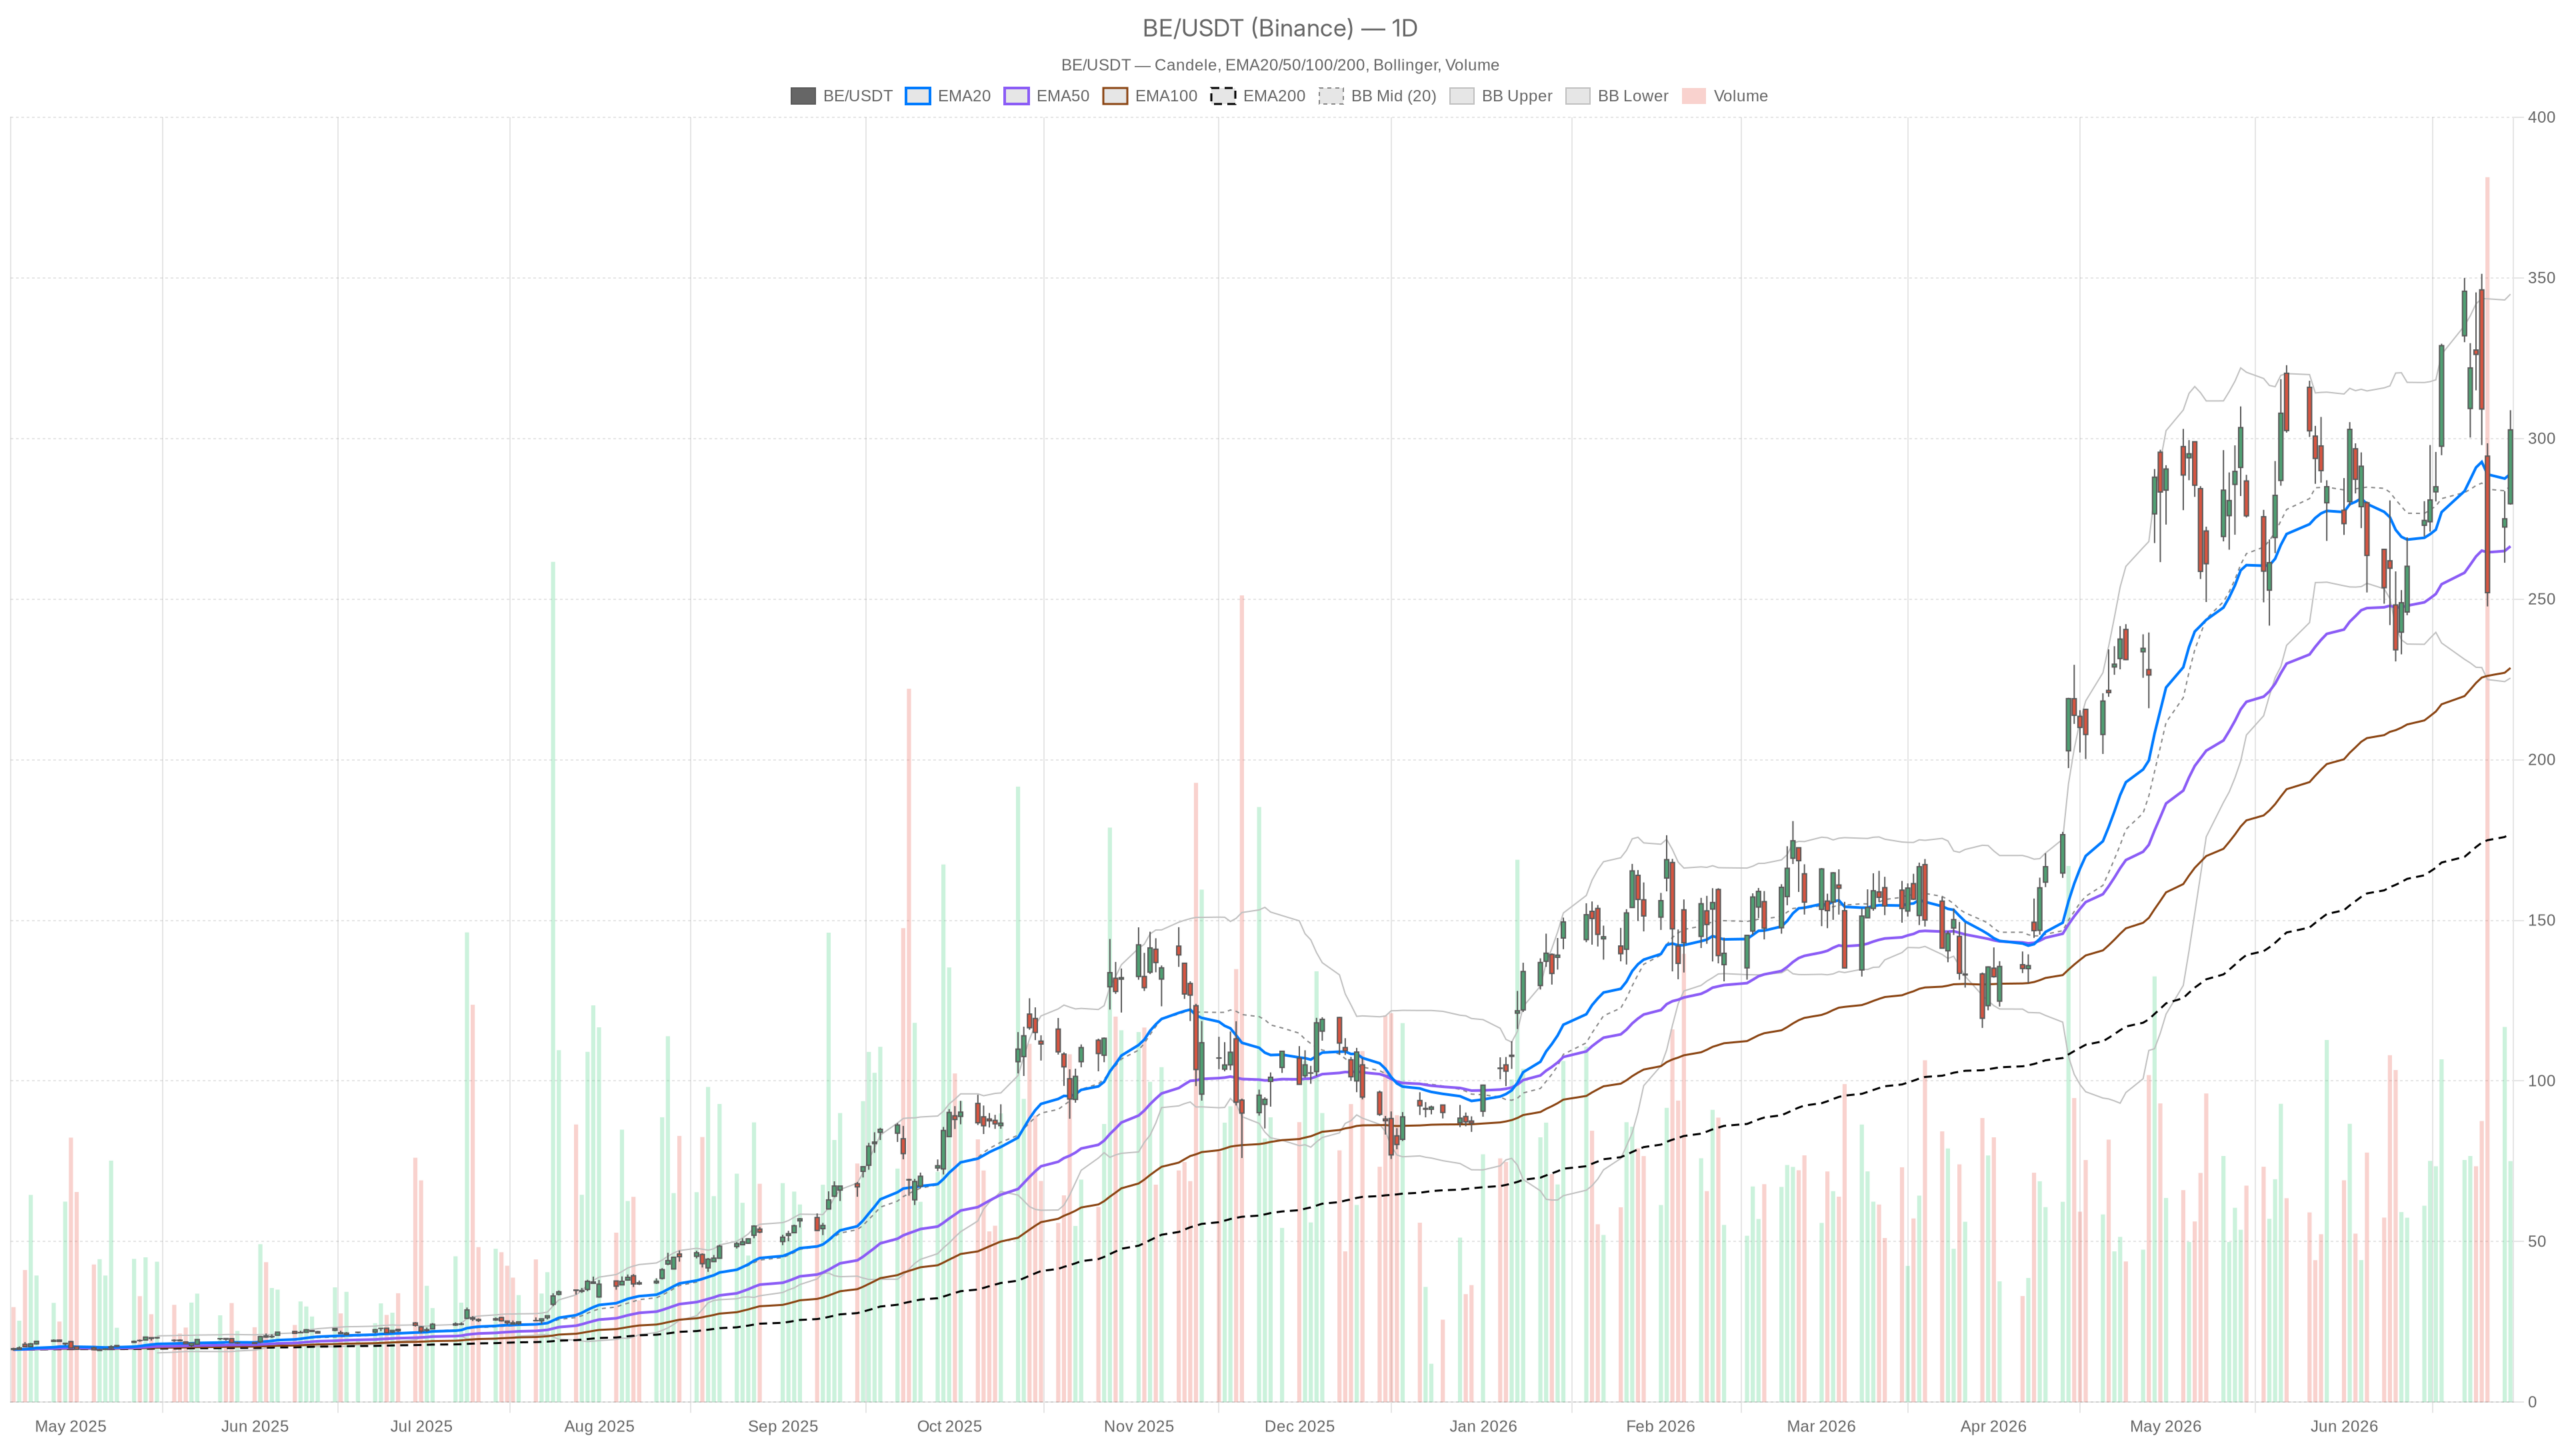 BE — daily chart with candlesticks, EMA20/EMA50 and volume.
Key takeaways
- BE closed at $302.70 on June 30 after touching an intraday high of $308.82, as the Brookfield deal expanded from $5 billion to $25 billion for AI data center deployments.
- The stock trades well above its 20-day EMA at $288.97 and 50-day EMA at $266.47, with the 200-day EMA far below at $177.21 — underscoring a roughly 1,000% surge over the past year.
- Daily RSI at 53.7 signals room for additional upside, but the negative MACD histogram at -1.38 warns that momentum is already decelerating at the margin.
- Daily ATR of $32.69 reflects extreme volatility, making $30+ single-day swings entirely normal for this stock.
- A hold above the $285–$288 EMA zone with a breakout above hourly resistance at $305.17 opens a technical path toward $314.55 and potentially the $344.96 upper Bollinger Band.
Bloom Energy Stock Daily Trend and Key Levels
Bloom Energy stock’s daily trend is decisively bullish going into the second half of 2026. Price sits comfortably above all major moving averages, and the widening EMA spread reflects genuine momentum rather than a slow drift higher.
EMA Alignment Confirms Trend Acceleration
The 20-day EMA at $288.97 and the 50-day EMA at $266.47 both sit well below the current close of $302.70. The gap between these two levels continues to widen. That is a hallmark of sustained trend strength, not a temporary spike.
Meanwhile, the 200-day EMA at $177.21 underscores the sheer magnitude of BE’s advance. The stock has surged roughly 1,000% over the past year on AI data center demand and US grid constraints. That kind of move demands structural price support, not just sentiment.
Volatility and Price Range Context
Bollinger Bands place the upper band at $344.96 and the lower band at $225.43, with the midline at $285.19. The current close sits in the upper half but remains well below the upper band. This leaves genuine technical room to the upside before the stock enters a statistically extreme zone.
However, the daily ATR of $32.69 demands respect. Single-day swings exceeding $30 are the norm here. This is not a stock for the faint-hearted.
Pivot Points Define Immediate Boundaries
Daily pivot analysis sets resistance at $314.55 (R1) and support at $285.13 (S1), with the central pivot at $296.97. Given Tuesday’s close of $302.70, Bloom Energy stock is holding constructively above its daily pivot heading into the next session.
Momentum Indicators Show Mixed Signals
Turning to momentum indicators, the picture for Bloom Energy stock is nuanced. The trend remains intact, but leading indicators suggest the rate of change is already decelerating.
Notably, daily RSI at 53.7 sits in positive territory without approaching overbought levels. After an extended rally, an RSI in the low 50s frequently signals cooled momentum — enough to permit a secondary leg higher. At the same time, it reflects some loss of near-term conviction.
The MACD reinforces this caution. The MACD line at 7.41 sits below the signal line at 8.79, producing a negative histogram of -1.38. This is not a reversal signal. However, it is a clear warning that the easy gains may already be priced in.
Intraday Timeframe Analysis
Shifting to shorter timeframes, the picture becomes more nuanced. The hourly regime is classified as neutral, which partially complicates the clean bullish read from the daily chart.
Hourly Chart Shows a Fresh Bullish Crossover
The hourly EMA structure remains stacked constructively. The 20 EMA at $292, 50 EMA at $295.10, and 200 EMA at $288.80 all sit below price. Notably, the gap between price and these averages suggests the stock may need to consolidate before mounting another leg higher.
In contrast to the daily MACD, the hourly MACD paints a more encouraging picture. The MACD line at 0.97 is crossing above a deeply negative signal line at -3.86, producing a surging histogram of 4.82. This fresh bullish crossover on the intraday timeframe offers precisely the momentum confirmation traders seek after a large catalyst-driven gap. Hourly RSI at 55.4 is similarly constructive.
Meanwhile, hourly pivot data places tight resistance at $305.17 and support at $300.14. The stock is essentially coiling just below hourly R1. A break above $305 could open a short-term path toward $310–$315.
15-Minute Chart Favors Tactical Patience
On the 15-minute timeframe, the execution context is marginally less clean. The 15-minute RSI at 62.24 flirts with short-term overbought conditions. The MACD histogram at -0.94 suggests the very short-term momentum pulse is fading.
Still, the price structure remains intact above all three EMAs and pinned near the session pivot at $302.11. The 15-minute ATR of $3.10 reflects tight near-term conditions that may resolve into a directional move once fresh volume arrives.
Therefore, for tactical entries, this setup favors waiting for a brief pullback toward $300–$301 rather than chasing at current levels.
Bull and Bear Scenarios for Bloom Energy Stock
Bloom Energy stock enters the second half of 2026 with a credible fundamental catalyst and a technically constructive daily trend. However, the setup demands weighing both outcomes carefully.
The Bull Case: Multi-Year Revenue Visibility
The Brookfield deal is not merely a headline. A $25 billion financing framework for Bloom’s fuel cell deployments into AI data center infrastructure addresses the single most important growth question. Can the company scale at the pace the market demands? The deal suggests the answer is yes, with institutional backing that significantly de-risks execution.
A sustained hold above the $285–$288 daily EMA zone is the first requirement. A breakout above hourly resistance at $305.17 would then open a path toward R1 at $314.55. A more aggressive momentum scenario could target the upper Bollinger Band at $344.96.
The Bear Case: Valuation and Momentum Risk
On the other hand, the bearish scenario deserves equal analytical weight. Seeking Alpha’s valuation concern is not fringe commentary. A stock that has surged roughly 1,000% in a year is pricing in a great deal of execution.
The negative daily MACD histogram signals that the rate of momentum increase is already decelerating. Broader market tightening or disappointing near-term earnings could trigger a reversion. A pullback toward the 50-day EMA at $266 is entirely plausible in that scenario. A daily close below S1 at $285.13 would serve as an early warning. A break below the 50-day EMA at $266 would effectively invalidate the near-term bullish structure.
FAQ
What is driving Bloom Energy stock higher in 2026?
The primary catalyst is the expanded Brookfield partnership. The financing framework grew from $5 billion to $25 billion for deploying Bloom’s fuel cell technology into AI data center infrastructure. This provides multi-year revenue visibility and answers the scalability question that had been the market’s central concern.
Is Bloom Energy stock overvalued after its 1,000% surge?
Valuation is a legitimate concern. The stock has priced in substantial execution expectations, and the negative daily MACD histogram confirms momentum is already decelerating. However, the Brookfield deal provides a credible fundamental underpinning that partially justifies the current premium. The daily RSI at 53.7 suggests the stock is not technically overbought, leaving room for further upside if catalysts continue to materialize.
What are the key technical levels to watch for BE?
Key support sits at the daily S1 pivot of $285.13 and the 50-day EMA at $266.47. On the upside, immediate resistance sits at the hourly R1 of $305.17, followed by the daily R1 at $314.55. The upper Bollinger Band at $344.96 represents a more aggressive target in a sustained momentum scenario.
How volatile is Bloom Energy stock?
Bloom Energy stock carries a daily ATR of $32.69, meaning $30+ single-day swings are entirely normal. This is not a stock suited to low-risk positioning. Traders and investors should size accordingly and expect significant two-way price movement on any given session.
Disclaimer: This article is for informational purposes only and does not constitute financial advice, an investment recommendation, or a solicitation to buy or sell any financial instrument or cryptocurrency. The analysis provided is not indicative of future results. Investing in crypto assets and financial markets carries a high risk of capital loss. Always do your own research (DYOR) and consult a qualified financial advisor before making any decision.
Article produced with the assistance of artificial intelligence and reviewed by the editorial team.


You May Also Like

Citi Cuts Bitcoin Target to $82,000 and Ether to $2,240 as ETF Outflows Weigh on Crypto Outlook

BlackRock Transfers $212M in Bitcoin to Coinbase, Signaling ETF Activity