Solana (SOL) Consolidates at $70: Critical Breakout Levels Traders Are Watching
Key Takeaways
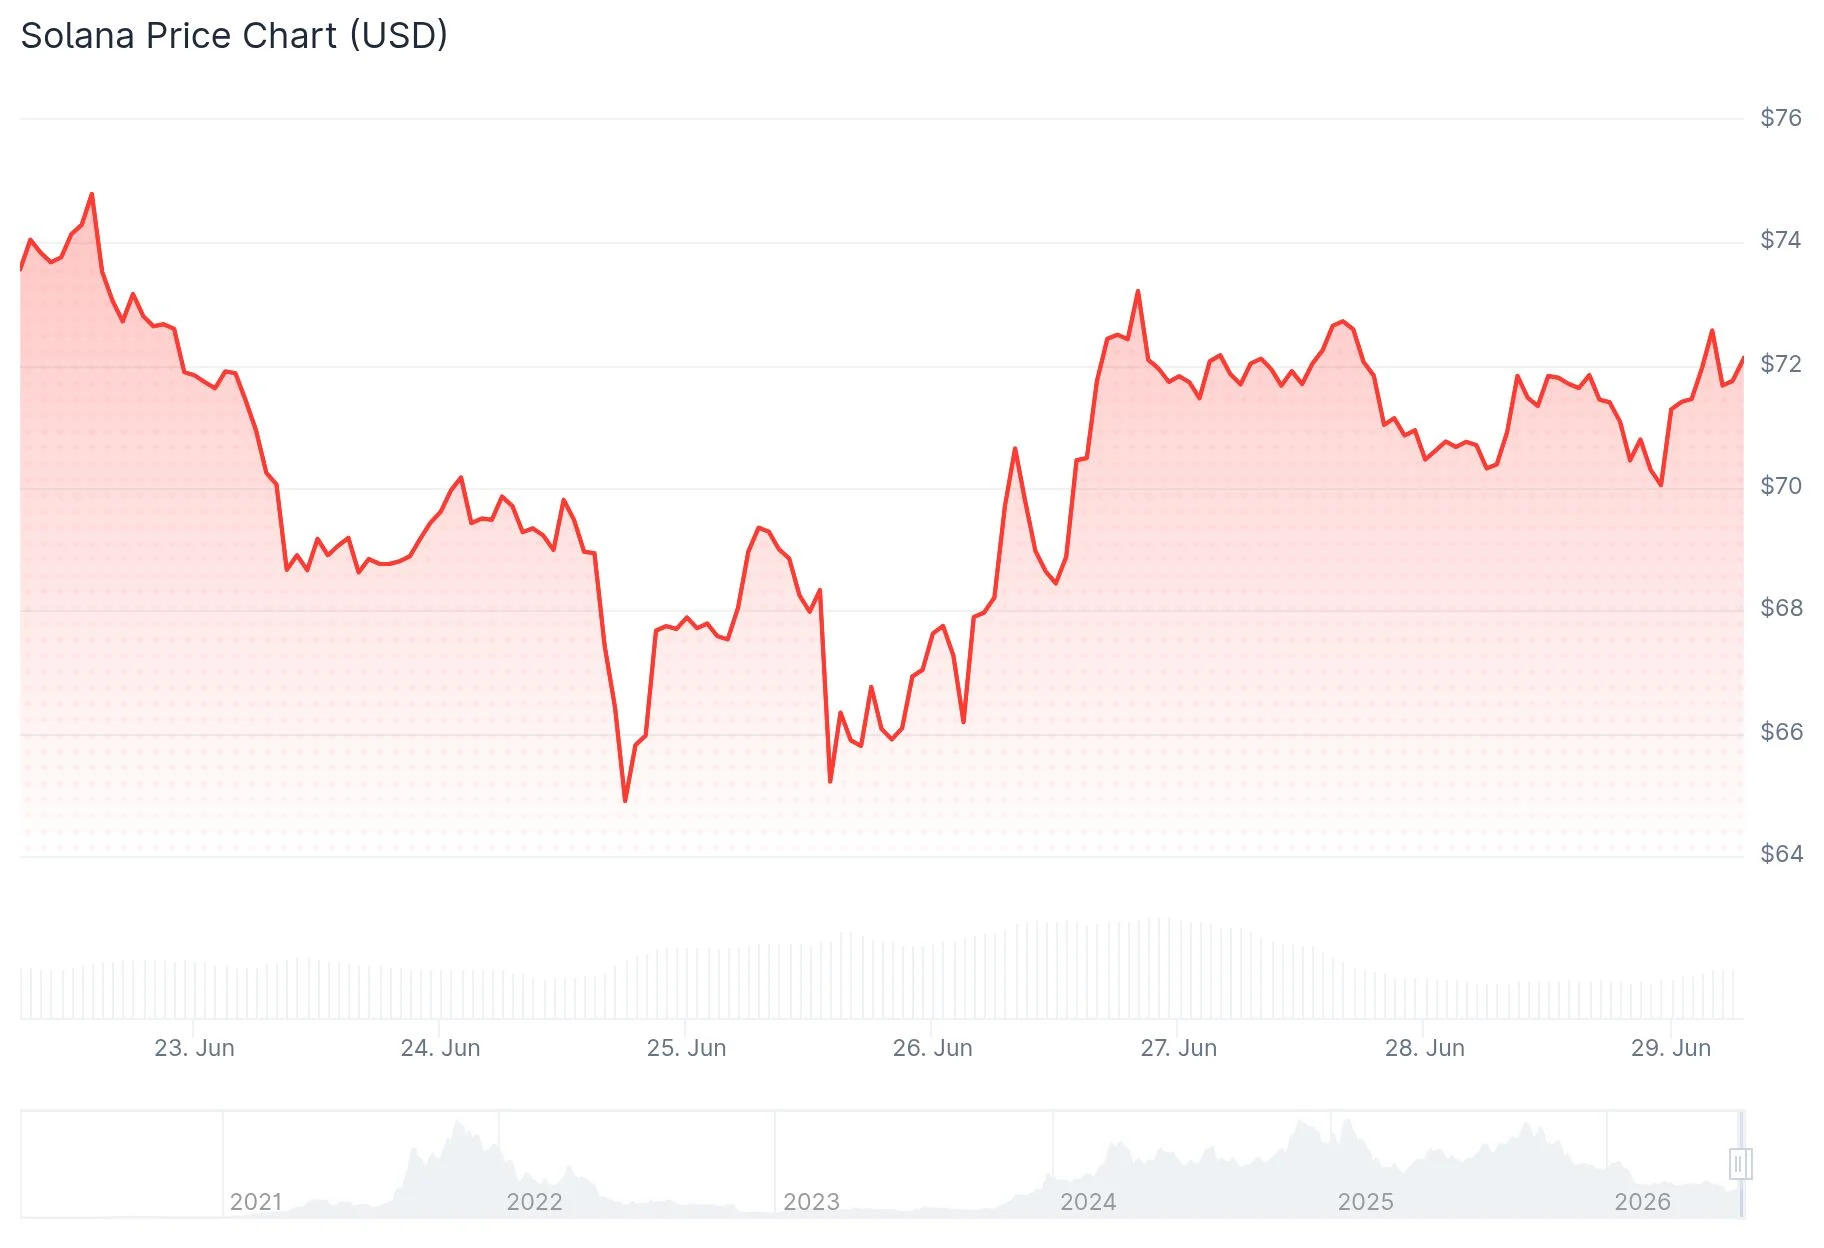
- SOL currently trades around $70.67, testing a critical descending resistance line
- Breaking above $80 could unlock immediate price targets between $90 and $95
- Solana’s tokenized equity trading volume reached an all-time daily high of $553 million
- Crypto analyst Michaël van de Poppe projects $120–$130 as achievable in the third or fourth quarter of 2026
- Technical chart formations indicate a potential climb toward $500 if critical resistance zones are breached
Solana is currently changing hands around $70.67 as of June 29, 2026, experiencing a 1.82% decline over the previous 24-hour period. The digital asset maintains its position above the crucial $70 support threshold, though buyers haven’t yet delivered confirmation of a sustained upward reversal.
 Solana (SOL) Price
Market participants are closely monitoring the $72–$75 price corridor. This range represents where a downward-sloping resistance line currently resides, and bullish traders must recapture this territory before any substantial upward movement can materialize.
Should SOL successfully pierce above $75, attention will shift to the $80 level. This represents the primary confirmation threshold that market observers are tracking.
A decisive daily close beyond $80 would tilt near-term price momentum in favor of buyers and establish $90 and $95 as realistic upside objectives. The $90 region aligns with clearly defined upside liquidity clusters visible on trading charts.
Conversely, failure to maintain the $70 floor could send prices tumbling toward the $65–$60 range. A more severe decline would potentially retest the $50 liquidity zone.
Trading strategist Michaël van de Poppe shared his perspective on X, suggesting SOL appears positioned to reclaim its previous trading range. He indicated that if this range recapture occurs, momentum is unlikely to stall at those levels, characterizing a successful range flip as a straightforward buying signal. Van de Poppe outlined $120–$130 as achievable price objectives during the third or fourth quarter of the current year.
On-Chain Metrics Show Strength
Tokenized stock trading on Solana established a new single-day volume benchmark at $553 million. Market analyst Whale Factor highlighted how Solana’s blockchain applications are diversifying beyond speculative meme tokens and conventional cryptocurrency exchanges.
The real-world asset ecosystem operating on Solana currently commands $3.18 billion in aggregate value across more than 291,000 individual holders, positioning it as the leading blockchain platform measured by RWA participant count.
Application-generated revenue on Solana totaled $19 million during the previous week and $85 million throughout the past month. Decentralized exchange spot trading volume registered $12.3 billion over the seven-day period.
Technical Formations Signal Potential
Chart analyst JAVONMARKS identified a cup and handle configuration on the 12-day timeframe. A decisive move above the $260–$280 resistance band accompanied by robust trading volume would confirm this pattern, establishing an upside objective exceeding $500.
Market commentator Crypto Patel has outlined a longer-horizon strategy involving Solana accumulation within the $40–$60 price window with ultimate targets at $500 and $1,000. He drew parallels between the current price correction and the 2022–2023 market bottom that preceded the subsequent 2023–2024 bull run.
An additional falling wedge technical structure remains in play across the broader timeframe, projecting a long-range target near $233 if SOL ultimately breaks free from this formation.
The daily chart still requires a closing price above the descending trendline to validate the optimistic scenario. The weekly MACD indicator has not yet generated a bullish crossover signal, according to technical analyst Dami-Defi.
SOL most recently traded at $71.44, registering a 0.43% decrease over the past 24 hours, based on Brave New Coin market data.
The post Solana (SOL) Consolidates at $70: Critical Breakout Levels Traders Are Watching appeared first on Blockonomi.


You May Also Like

Ken Griffin Just Sold 40% of His Palantir (PLTR) Stock — Should You?

Binance Perpetual Futures Revolution: QQQ and Major US Stocks Enter Crypto Derivatives Market with 10x Leverage