

Marriott Stock Runs 20% in Under Six Months: Is the Fee Revenue Story Already Priced In at $377?
Key Takeaways for Marriott Stock as of June 2026
- Analysts rate Marriott stock 11 buys / 12 holds / 2 sells / 1 underperform with a mean target of around $381, implying roughly 1% upside from the current price of $377.
- TIKR’s mid-case model values Marriott at around $424 by December 2030, implying around 12% total return, or roughly 3% annualized.
- Q1 2026 gross fee revenues rose 12% year over year to $1.43 billion, driven by a 37% surge in co-branded credit card fees and a 70%+ jump in residential branding fees, both above prior guidance.
Track Marriott’s fee revenue trajectory and EBITDA margin expansion in real time. See whether Q2 estimates hold as the Middle East headwind peaks. Check MAR’s financials on TIKR for free
Marriott’s Q1 Fee Revenue Surge Beats Estimates, but a 125 Basis Point Middle East Drag Clouds the Full Year
Marriott International (MAR) reported first-quarter 2026 results on May 6 that beat expectations on every major metric, with global revenue per available room (RevPAR, the hospitality industry’s core demand measure) rising 4.2% and adjusted EBITDA growing 15% year over year to $1.4 billion against a Street estimate of $1.3 billion.
The beat did not come from rooms or occupancy alone. Fee revenues, the more structurally valuable revenue stream for Marriott’s asset-light model, did the heavy lifting.
 MAR Stock Q1 2026 Earnings in USD (TIKR)
That growth came from a combination of sources beyond RevPAR. Total gross fee revenues reached $1.43 billion, up 12% year over year, with co-branded credit card fees jumping 37% and residential branding fees surging more than 70%. These are recurring, high-margin income streams with little direct exposure to nightly occupancy swings, and both outpaced guidance.
CFO Jennifer Mason, addressing the sources of the fee revenue beat directly on the Q1 earnings call, framed the diversification clearly: “Total gross fee revenues increased 12% year-over-year to $1.43 billion, reflecting higher RevPAR, rooms growth, a 37% increase in co-branded credit card fees and an over 70% increase in residential branding fees.” That structural mix shift toward credit cards and branded residences matters for how investors should read EBITDA margins going forward.
Still, the quarter wasn’t without tension. A conflict in the Middle East, which escalated in late February when the U.S. and Israel struck Iran, disrupted travel corridors and weighed on Marriott properties in the region. Middle East RevPAR fell more than 30% in March alone, and management guided for Q2 to be the hardest-hit quarter, with RevPAR in the region expected to fall around 50%. The company estimates the conflict will weigh on full-year global RevPAR growth by 100 to 125 basis points.
Even so, the offset came from both ends of the quality spectrum. Luxury RevPAR rose nearly 7% in the U.S. and Canada, while select-service RevPAR, which had declined more than 1% in Q4 2025, rebounded to 3.5% growth in Q1.
Management noted the rebound partly reflects consumer pivoting toward domestic and drive-to destinations, boosted by higher tax refunds and historically low U.S. supply growth. The World Cup, beginning June 11, is expected to add 30 to 35 basis points to full-year global RevPAR.
Separately, Marriott reached a milestone in June by opening its 10,000th property, a JW Marriott in India, while its global pipeline hit a record of nearly 618,000 rooms, up more than 5% year over year.
Track Marriott’s fee revenue mix and pipeline conversions against peers. See what the credit card renegotiation with Visa, Chase, and Amex could mean for 2027 estimates. Dig into MAR’s fee breakdown on TIKR for free →
Wall Street’s Divided Verdict on Marriott Stock Leaves Little Consensus Upside
 Street Analysts Target for MAR Stock (TIKR)
Wall Street’s current rating distribution on Marriott stock as of late June 2026 skews toward caution rather than conviction, with 11 buys against 12 holds and 2 negative ratings among 25 analysts covering the name.
Wall Street Expects Marriott Stock’s EBITDA to Grow Around 9% in Full-Year 2026
 MAR Stock EBITDA and EBITDA Margins Actuals & Estimates (TIKR)
As of Q1 2026, Marriott posted EBITDA of $1.4 billion, up around 15% year over year, beating the Street’s estimate of $1.32 billion by around 6%. EBITDA margins reached 21.0%, expanding 158 basis points versus the prior year period.
For Q2 2026, the Street estimates EBITDA of around $1.54 billion, up roughly 9% year over year, even as Q2 is expected to carry the steepest Middle East impact. Management guided full-year adjusted EBITDA to roughly $5.88 billion to $5.97 billion, representing 9% to 11% growth, which the Street’s forward estimates broadly reflect across the back half of 2026.
Looking into 2027, forward estimates on EBITDA continue to project margin stability in the 21% range, supported by the fee revenue mix shift toward higher-margin credit card and residential branding income, partially offset by the IMF (incentive management fees) headwind from Middle East underperformance. EBITDA margins are projected at roughly 21.5% in Q2 2026 and 21.4% in Q3 2026.
The open question for the second half is whether the credit card renegotiation with Visa, Chase, and American Express, which management says is progressing well and expects to close later in 2026, delivers a material fee uplift before year-end, or whether the primary earnings impact lands entirely in 2027.
Marriott’s EBITDA Growth Led Peers in Q1 2026, but Hilton Closes the Gap Through 2027
 MAR Stock EBITDA Growth vs Peers (TIKR)
Marriott posted the strongest EBITDA growth among its three-way peer set in Q1 2026, at around 15% year over year, outpacing Hilton’s (HLT) around 13% and Hyatt’s (H) contraction of roughly 3% in the same quarter.
Into the estimates window, that lead narrows. Hilton’s EBITDA growth is projected to surpass Marriott’s by Q1 2027, at around 12% versus around 8%, a reversal that puts Marriott’s current valuation premium on a tighter foundation heading into the credit card renegotiation cycle.
TIKR’s $424 Target on MAR Stock Holds If Fee Revenue and Pipeline Conversions Deliver in 2027
TIKR’s mid-case model values Marriott at around $424 by December 2030, implying around 12% total return from the current price of around $377, or roughly 3% annualized over 4.5 years.
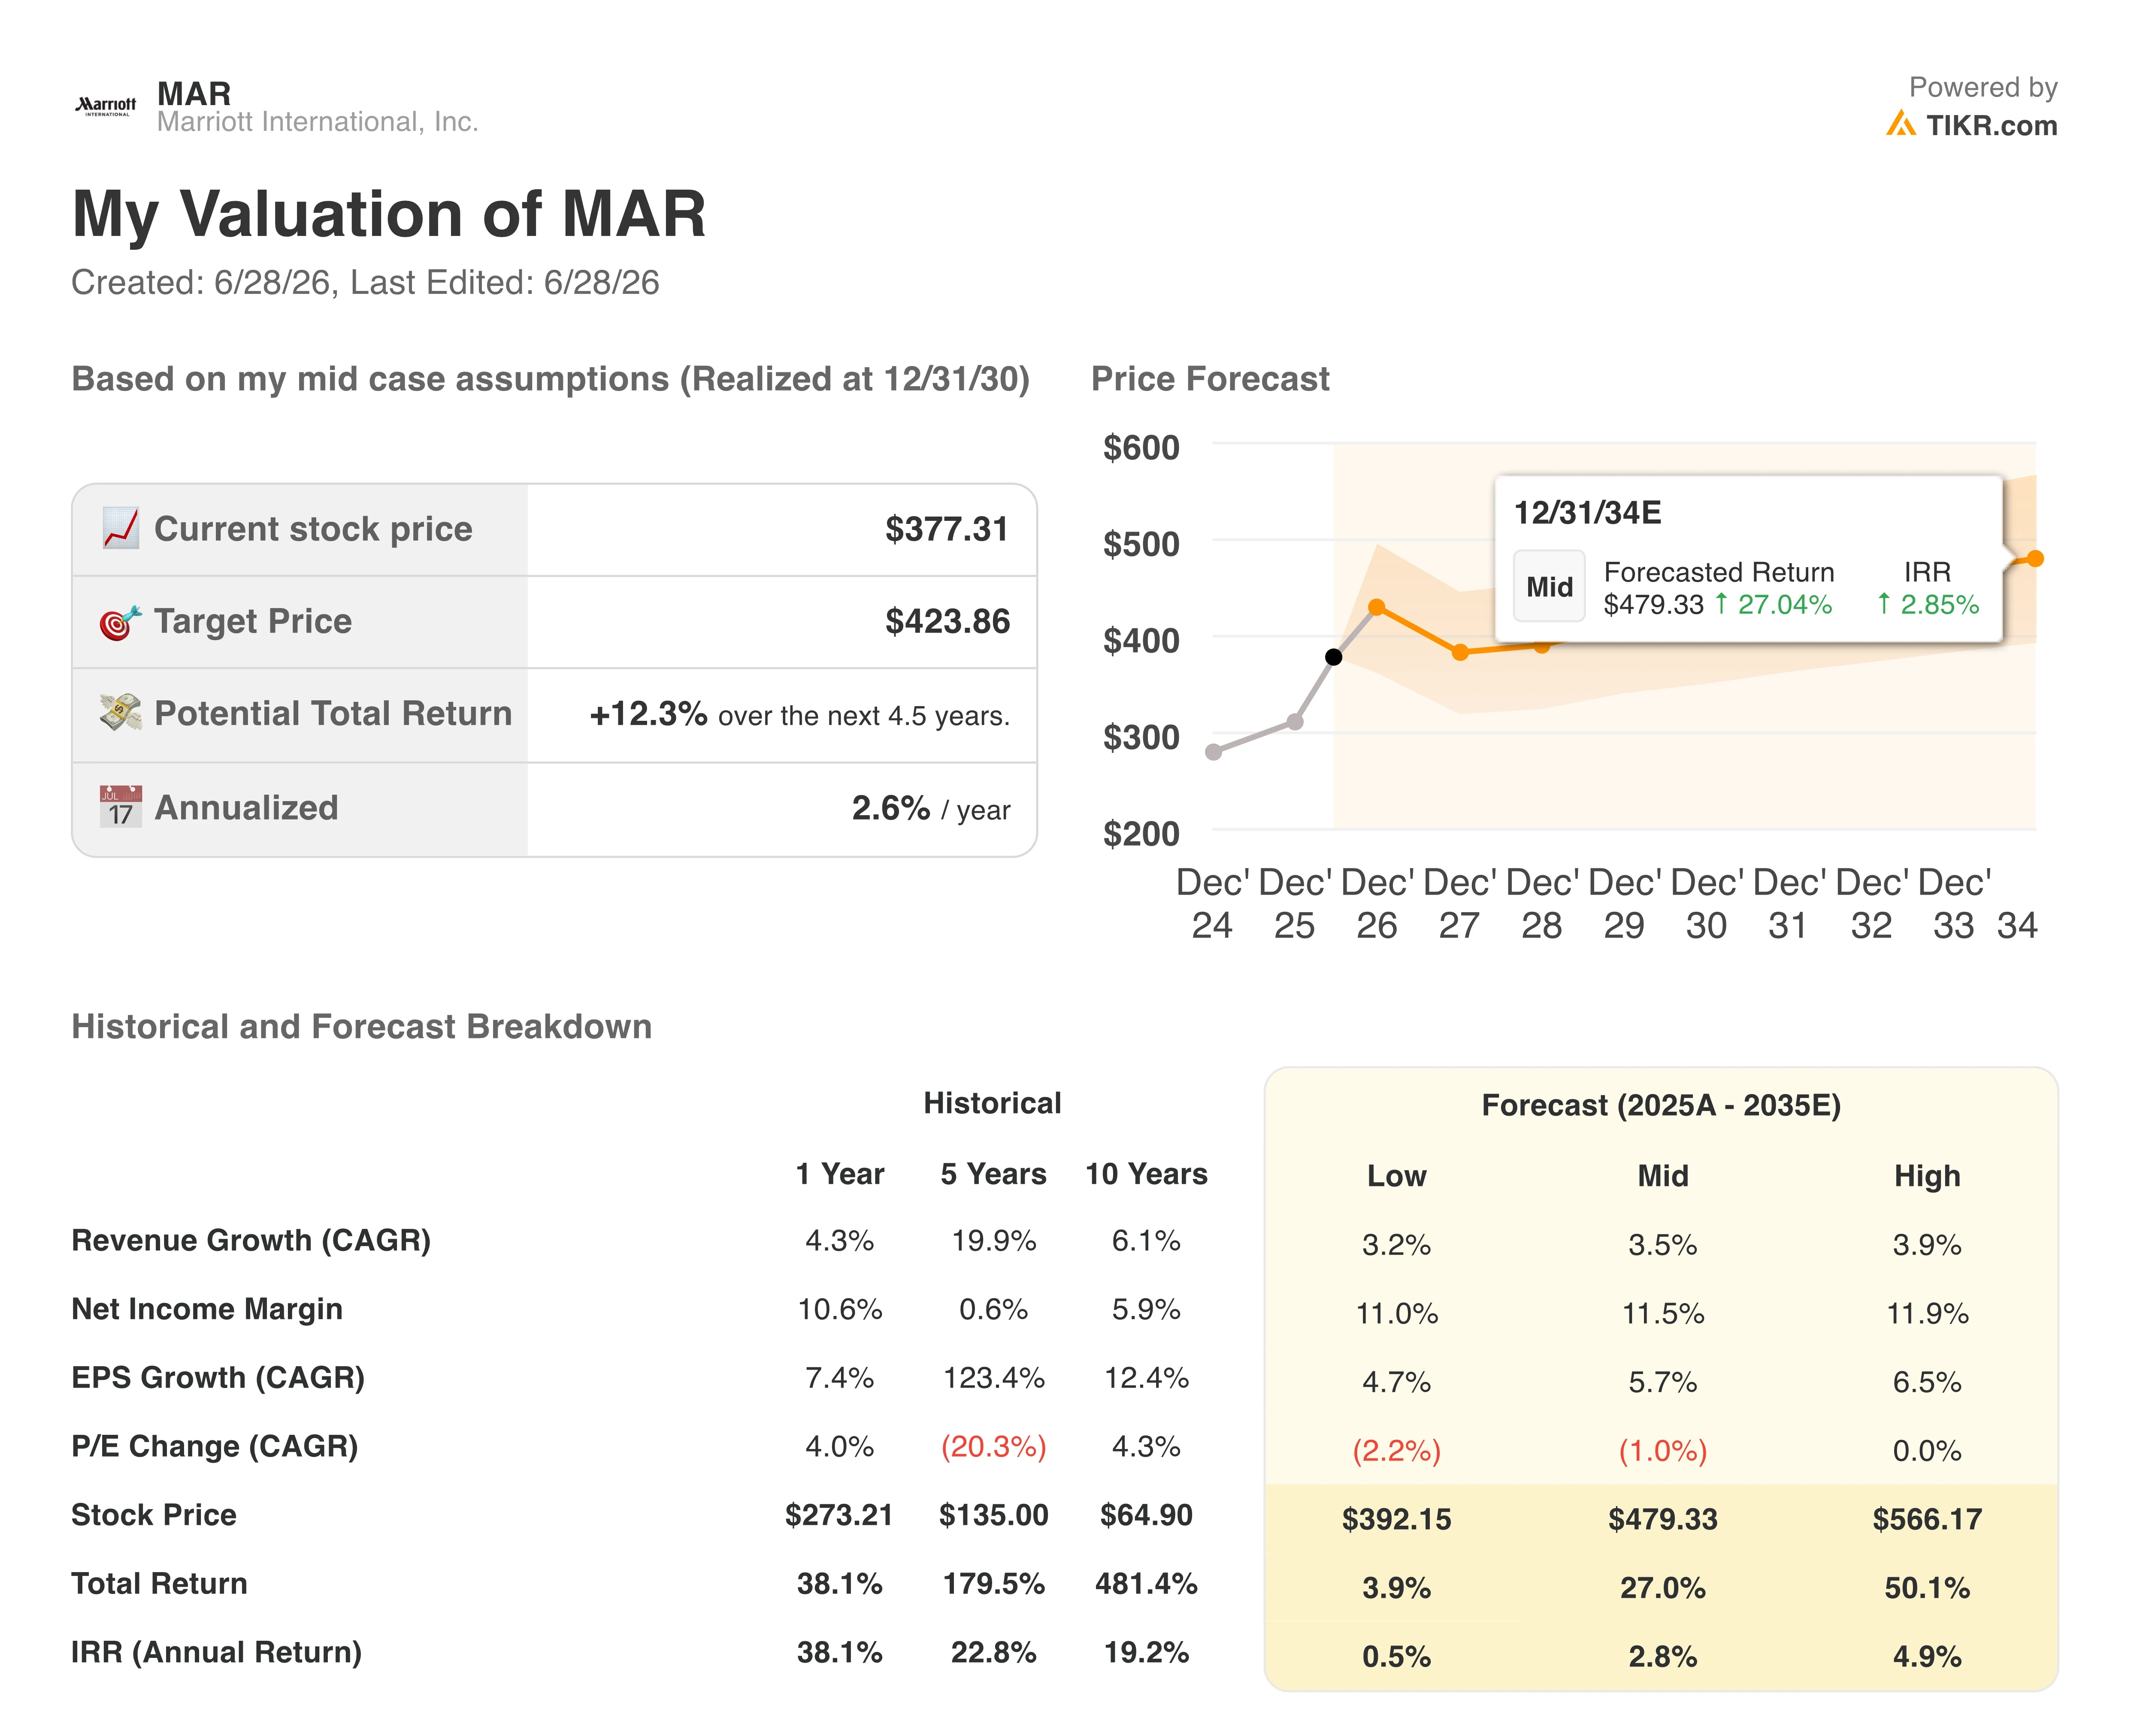 MAR Stock Valuation Model Results (TIKR)
For a business of Marriott’s global scale, that annualized return sits below what most growth-oriented investors require, signaling a stock the market is pricing with precision rather than overlooking.
The path to $424 is grounded in what Q1 already demonstrated: a fee revenue model that outgrew RevPAR, with gross fees up 12% on a 4.2% RevPAR gain, powered by credit card fees and residential branding income that carry structurally higher margins than room-night revenue. The pending credit card renegotiations with Visa, Chase, and American Express, which management expects to close later in 2026, represent the most material unpriced catalyst between now and the realization date.
Wall Street’s best ideas don’t stay hidden for long. Catch analyst upgrades, earnings beats, and revenue surprises on thousands of stocks the moment they happen with TIKR for free →
Should You Invest in Marriott International, Inc.?
The only way to really know is to look at the numbers yourself. TIKR gives you free access to the same institutional-quality financial data that professional analysts use to answer exactly that question.
Pull up Marriott International stock and you’ll see years of historical financials, what Wall Street analysts expect for revenue and earnings in the quarters ahead, how valuation multiples have moved over time, and whether price targets are trending up or down.
You can build a free watchlist to track Marriott International alongside every other stock on your radar. No credit card required. Just the data you need to decide for yourself.
Access Professional Tools to Analyze MAR stock on TIKR for Free →
You May Also Like

Why The Green Bay Packers Must Take The Cleveland Browns Seriously — As Hard As That Might Be

Luck, Stupidity, and Getting Ripped Off

Why an Altcoin Rally Could Start When Everything Still Looks Terrible

