

Solana price rebounds on Morgan Stanley ETF update as $75 test looms
Solana price has surged nearly 9% over the past three days after Morgan Stanley updated its spot ETF filing, putting the token back within striking distance of the $75 resistance zone.
- Solana rallied nearly 9% after Morgan Stanley updated its spot Solana ETF filing and introduced a 0.14% fee structure.
- Technical indicators show SOL approaching major resistance near $75, with analysts divided on whether a breakout is imminent.
- Liquidation data reveals heavy leverage clustered around $75, while $70 remains the key support level for bulls.
According to data from crypto.news, Solana (SOL) price climbed from around $68 on June 19 to an intraday high of $74.98 on June 22 before consolidating near $73.7 at the time of writing.
SOL’s rally followed Morgan Stanley’s amended S-1 filing for its proposed spot Solana ETF, which introduced a 0.14% sponsor fee and identified Figment and Coinbase Canada as staking providers. Such an update strengthened expectations that institutional investors could gain regulated exposure to SOL while also participating in staking rewards.
The ETF development arrived after a sharp four-day correction that dragged Solana from a local high of $75.6 on June 15 to a low near $68. A stronger U.S. dollar, reduced risk appetite across crypto markets, and slower memecoin-related activity on Solana had pressured the token during that period.
The selloff, however, left derivatives markets heavily skewed toward short positions, creating conditions for a rapid reversal once buying pressure returned.
Futures traders amplified the move as SOL reclaimed several short-term resistance levels between $70 and $73.
Rising open interest during the advance suggests new leveraged positions entered the market rather than the rally being driven solely by short covering. The combination of ETF optimism and fresh derivatives participation helped sustain momentum throughout the weekend.
Morgan Stanley ETF filing fuels Solana price rebound from key support
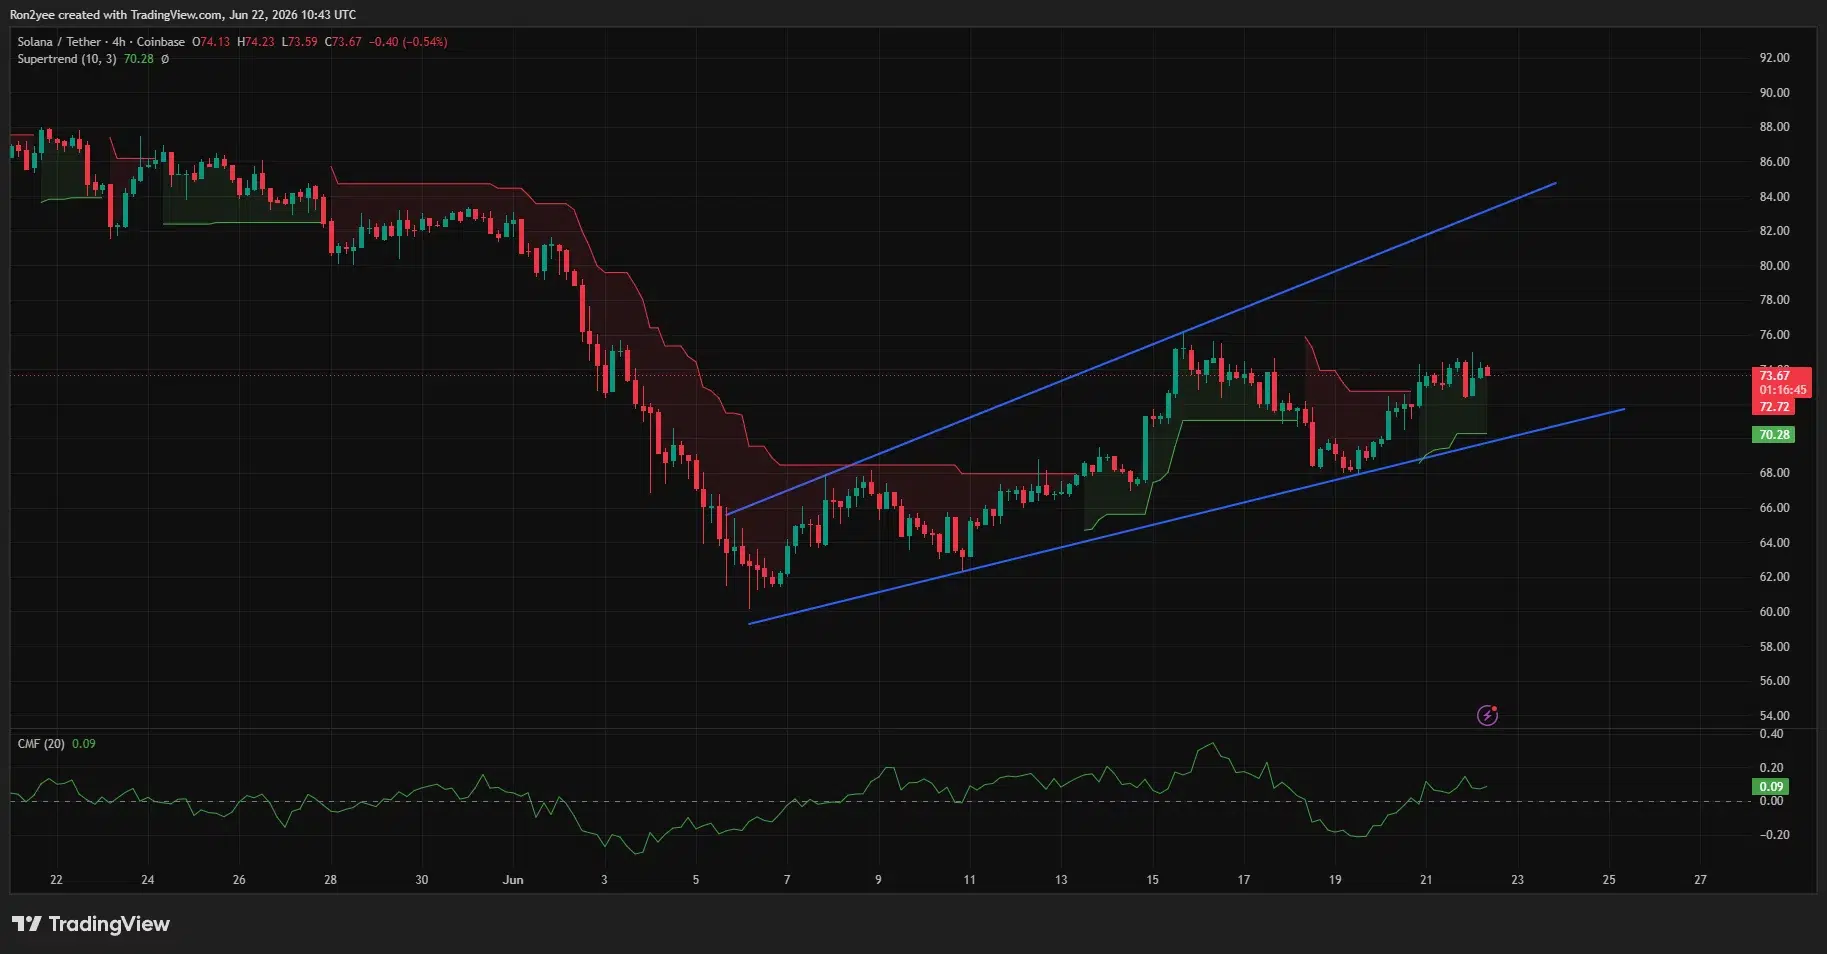
Technical charts show Solana trading inside a rising channel that has guided price action since the June 6 bottom near $60. On the four-hour chart, SOL remains above its Supertrend support at roughly $70.3, while Chaikin Money Flow has returned to positive territory, showing capital continues to enter the market after last week’s rebound.
The daily chart presents another important level. Solana has reclaimed the Murrey Math 3/8 support line at $68.75 and is now approaching the 4/8 major pivot level at $75.
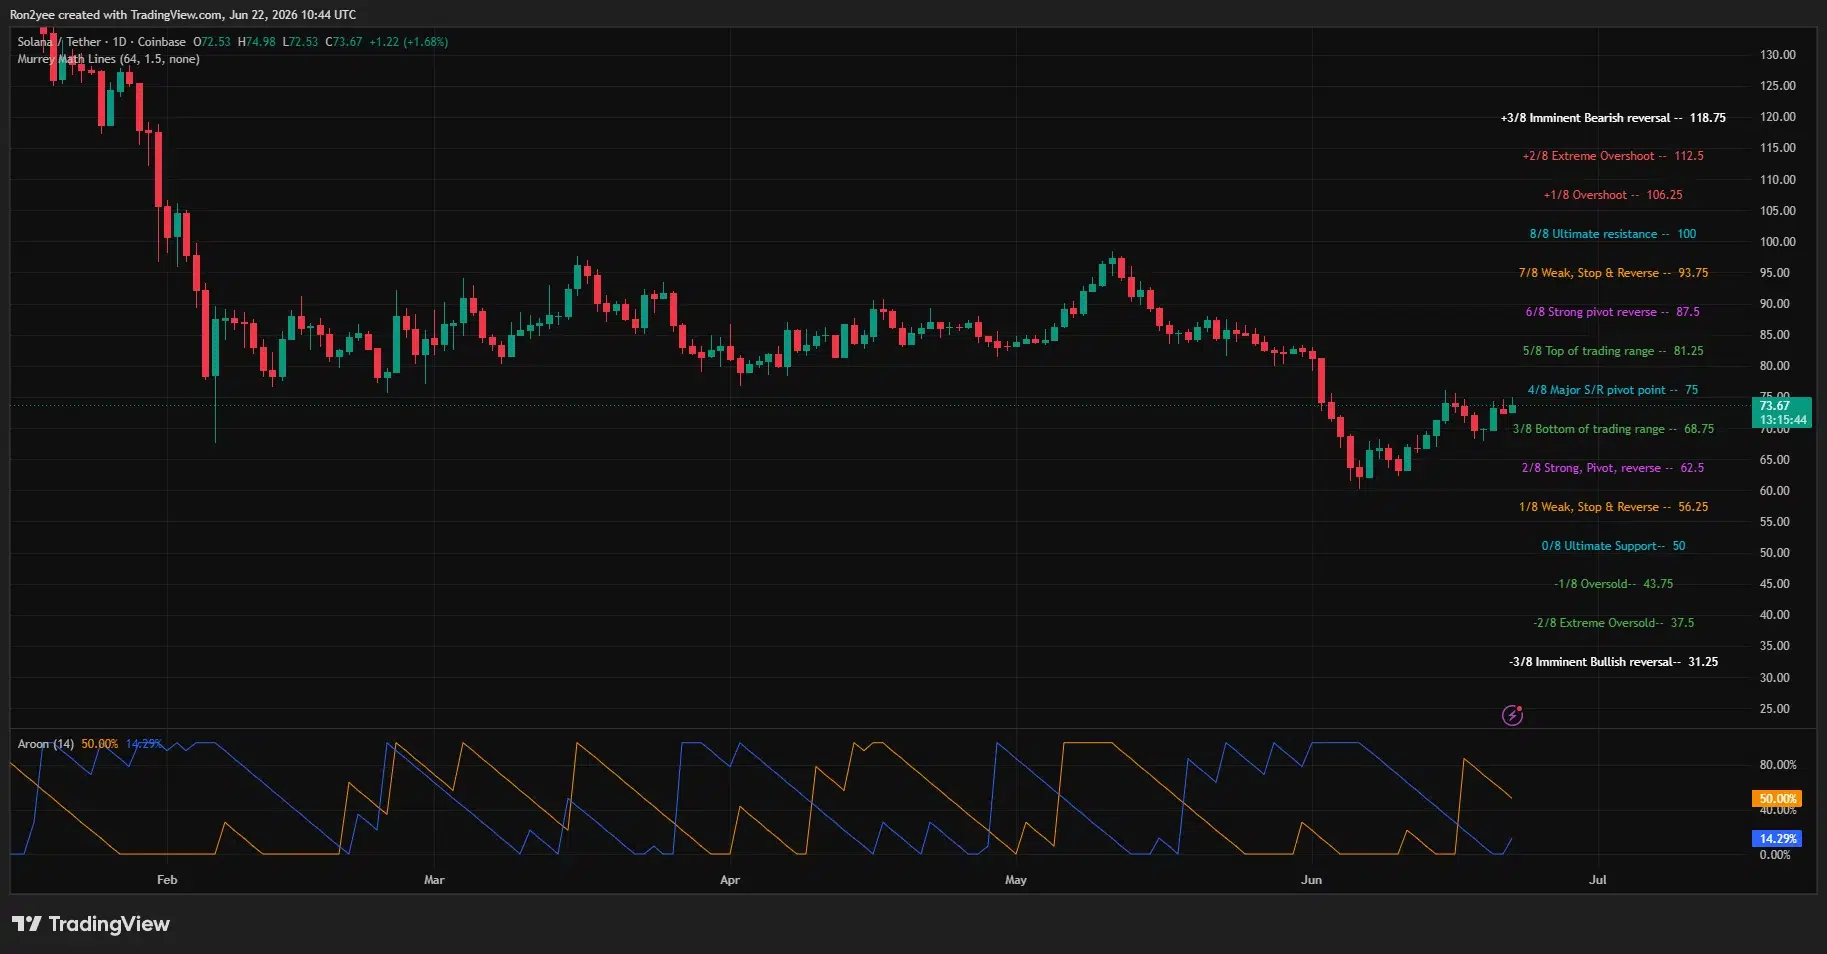
A decisive break above that zone could open a path toward the next resistance band around $81.25, with the upper boundary of the ascending channel projecting potential upside toward the mid-$80s.
However, not all analysts expect an immediate breakout. Commenting on the current setup, analyst Ali Martinez noted that Solana has entered a dense resistance cluster between $74.65 and $75.
“With the TD Sequential flashing a sell signal inside this heavy resistance cluster, the immediate structure favors a minor reset.”
Martinez added that the resistance area coincides with the four-hour 200 SMA and a TD Sequential sell signal, increasing the probability of a short-term pullback before any attempt to move higher.
Meanwhile, a separate observation from fellow analyst Team Lambo highlighted a bullish divergence on Solana’s weekly chart. While price recently printed lower lows, momentum indicators have begun forming higher lows, a structure often associated with trend reversals after prolonged declines.
Solana price nears key liquidation zone above $75
CoinGlass liquidation data shows a significant concentration of leveraged positions between $74.5 and $75.5, directly above current prices. A breakout through that zone could trigger another round of forced liquidations from short sellers, potentially accelerating a move toward $77 and beyond.
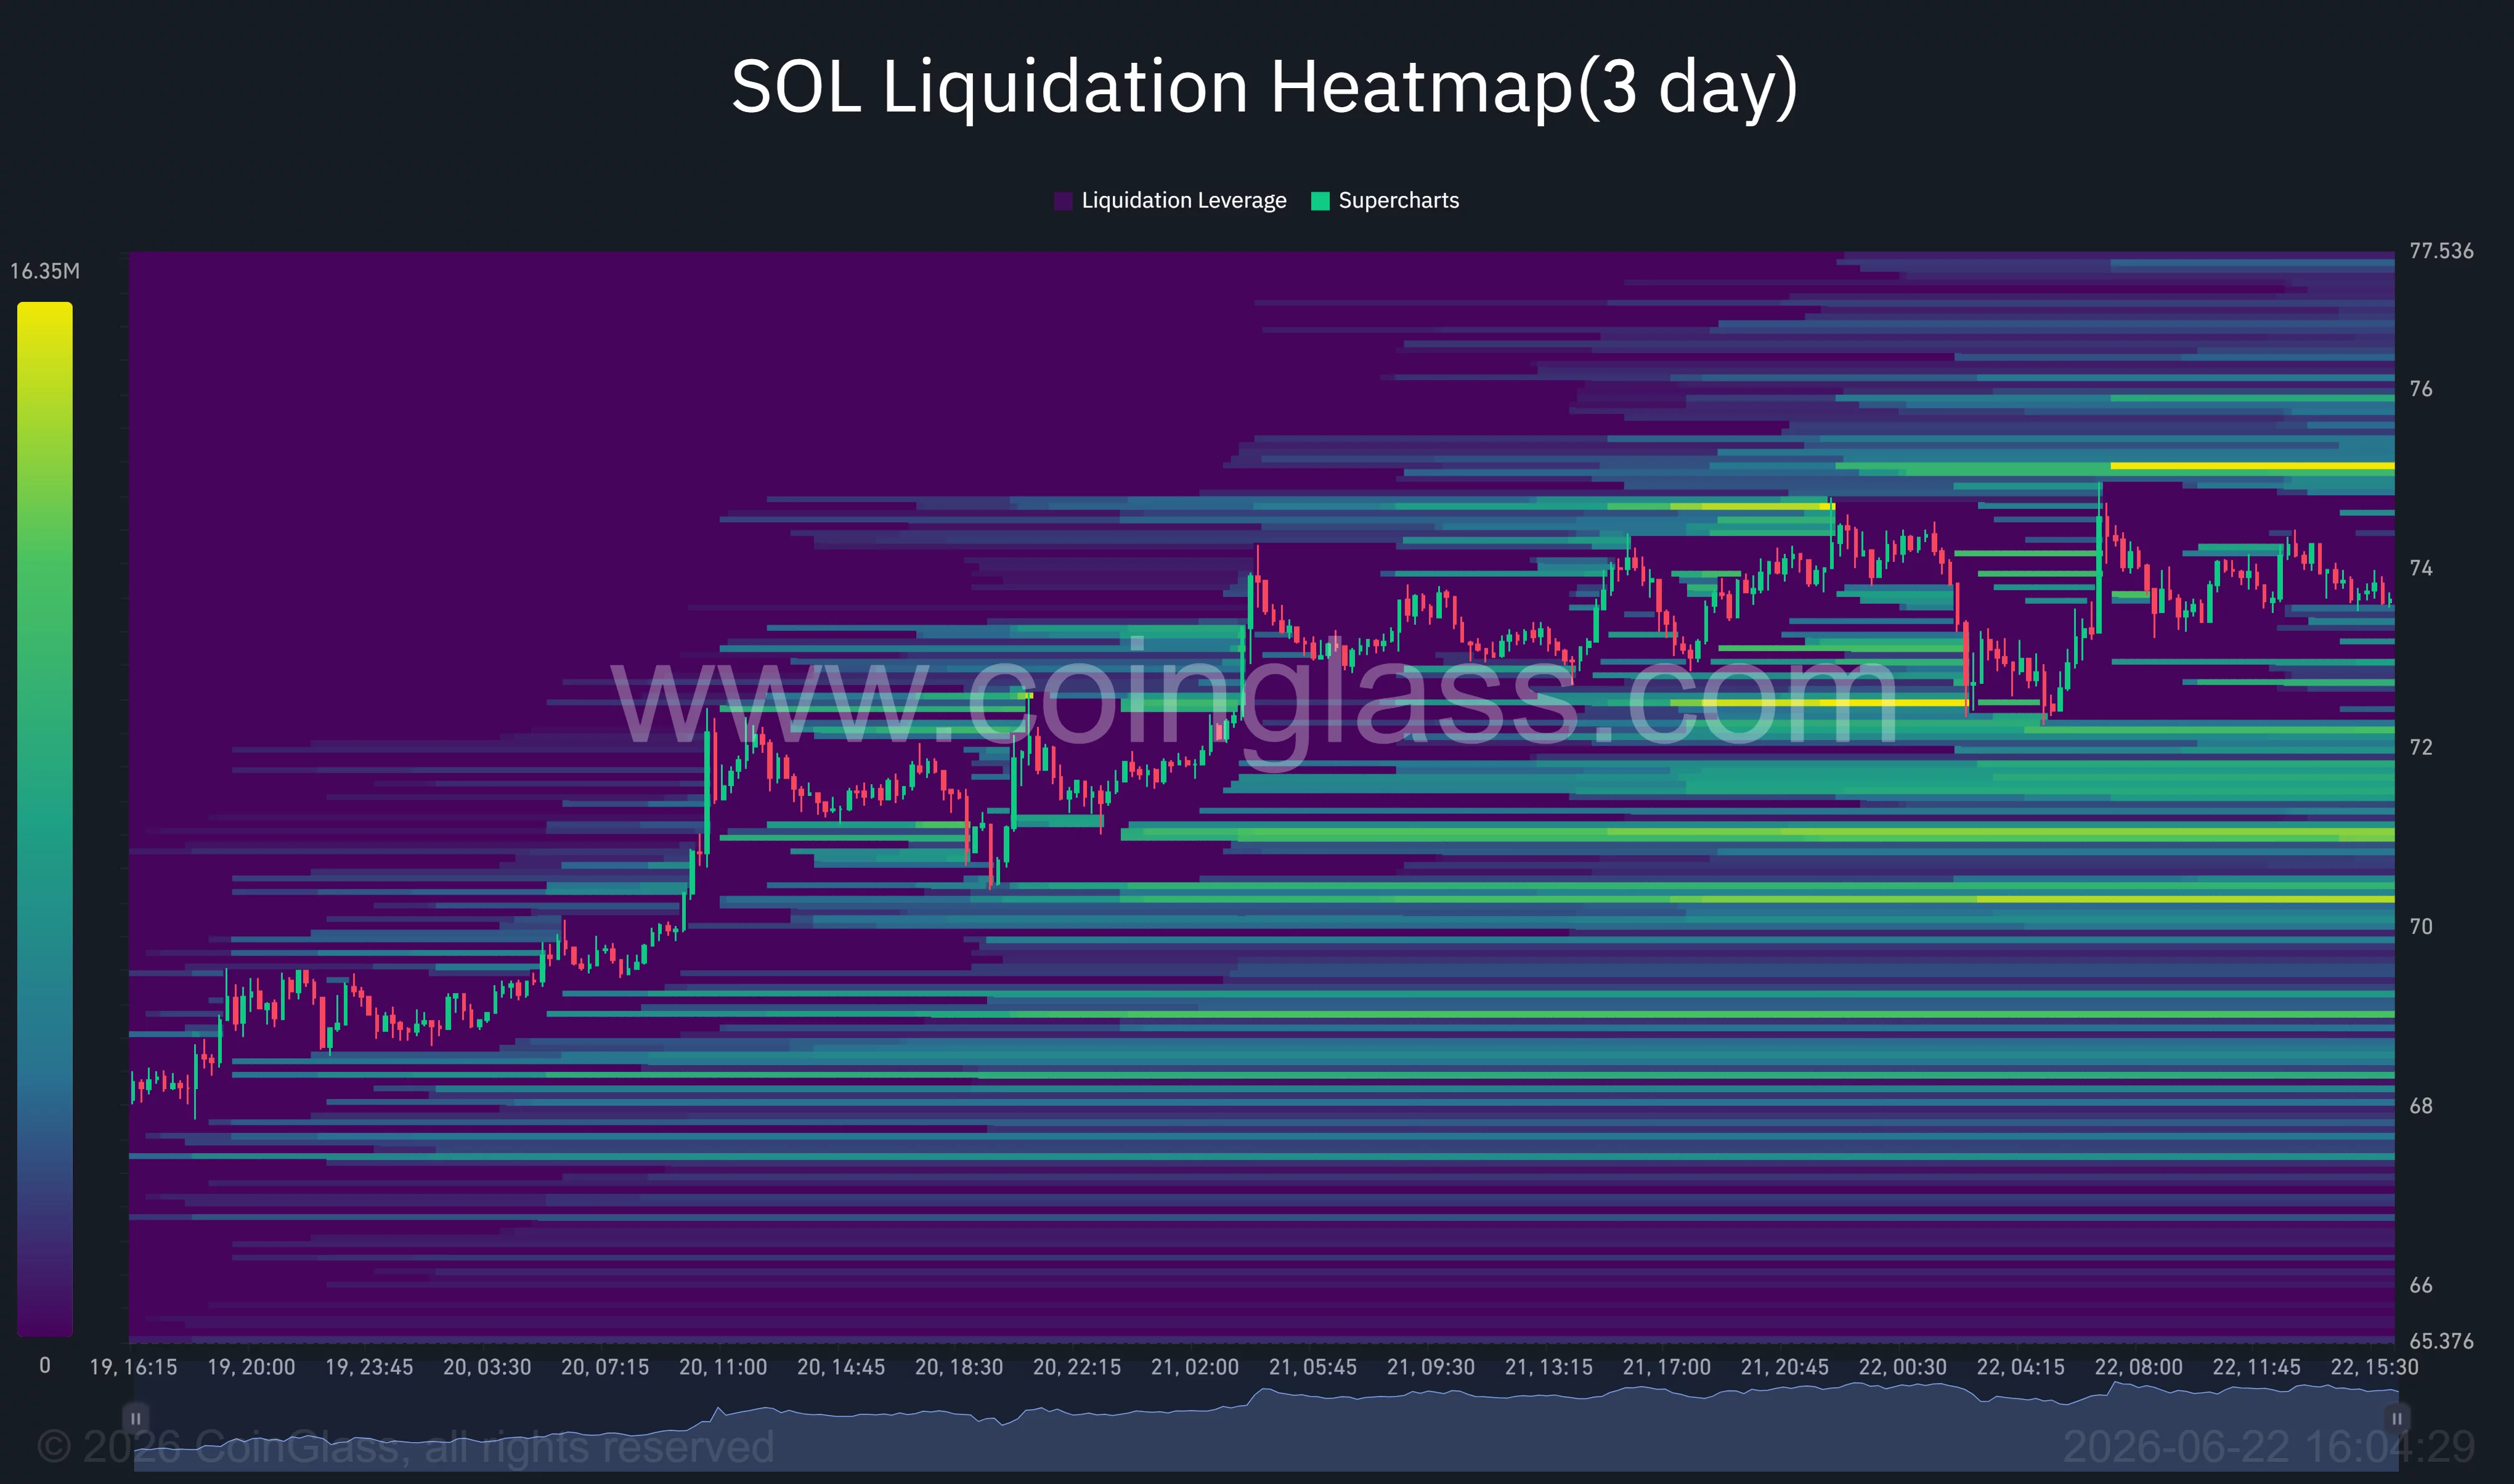
Below the market, the largest liquidity pockets sit around $72, $71, and $70. Those levels align closely with the rising channel support and Supertrend indicator, making them critical areas for bulls to defend.
A loss of $70 would weaken the current recovery structure and expose Solana to a deeper retracement toward $68, the level identified by Martinez as an extended downside target.
Macro conditions remain another variable. Any renewed strength in the U.S. dollar, deterioration in risk sentiment, or delays surrounding U.S. crypto ETF approvals could slow institutional demand and interrupt the current advance.
Disclosure: This article does not represent investment advice. The content and materials featured on this page are for educational purposes only.


You May Also Like

Metaplanet buys 5,075 Bitcoin in Q1 to become 3rd-largest treasury

Covéa Chooses Shift Technology as Strategic Partner for Fraud and Risk Management

VERAXA Biotech to Showcase BiTAC Cancer Platforms at BIO International Convention


Trending News
More24/7 Live News
MoreQuick Reads
More
