

BlackRock’s IBIT leads Bitcoin ETFs back into outflows as BTC price slides
U.S. spot Bitcoin ETFs returned to net outflows on Friday after briefly snapping a record withdrawal streak, with BlackRock’s IBIT leading the declines as Bitcoin fell below the key $60,000 support level and investor sentiment deteriorated.
- Bitcoin ETFs posted $325.7 million in outflows, led by BlackRock’s IBIT with $213.7 million withdrawn..
- Bitcoin price fell below $60,000 to a low near $59,100, while analysts linked continued ETF outflows and a more hawkish Federal Reserve outlook to the market decline.
- Analysts say $60,000 remains key support, with downside risk toward $55,000.
According to data from SoSoValue, the ETFs recorded $325.69 million in net outflows on June 5, reversing the modest $3.05 million inflow posted a day earlier.
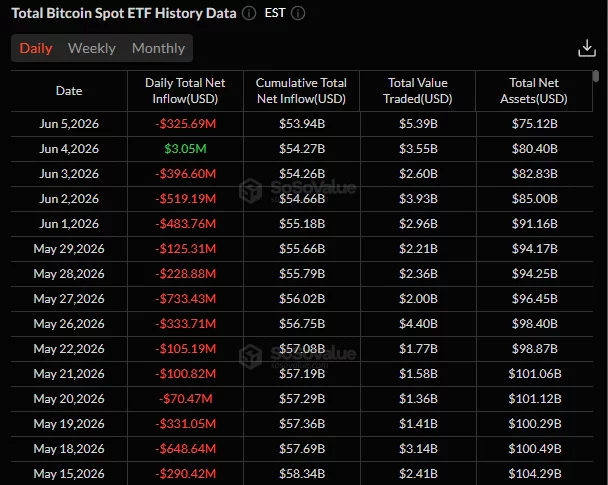
The latest withdrawals pushed cumulative net inflows across the category down to $53.94 billion and highlighted continued pressure on institutional Bitcoin demand after nearly three weeks of persistent redemptions.
BlackRock’s IBIT accounted for the largest share of the losses, recording $213.65 million in outflows on June 5. Fidelity’s FBTC and Grayscale’s GBTC followed with withdrawals of $59.69 million and $60.84 million, respectively. VanEck’s HODL and Morgan Stanley’s MSBT were the only products to attract fresh capital, bringing in a combined $8.5 million.
The renewed ETF selling coincided with a sharp decline in Bitcoin prices. According to data from crypto.news, Bitcoin (BTC) price plunged to an intraday low near $59,100 before rebounding above $61,000 at the time of writing. The move pushed the asset to its lowest level since October 2024 and extended a broader correction that has erased more than $15,000 from recent highs.
Why are Bitcoin ETFs seeing renewed outflows?
Recent ETF flow trends have attracted growing attention from Wall Street analysts. In a recent note, Citigroup argued that investors may be underestimating the role ETF demand plays in Bitcoin’s price performance.
The bank also pushed back against the narrative that Bitcoin’s recent decline was primarily driven by Strategy’s decision to sell 32 BTC for preferred stock distributions, arguing that sustained ETF outflows have played a much larger role in weakening prices.
As reported by crypto.news earlier, spot BTC ETFs recorded $2.43 billion in net ETF outflows during May and another $1.40 billion during the first three days of June, which played a major factor behind Bitcoin’s recent weakness. The latest $325.69 million redemption suggests institutional demand still remains fragile despite Thursday’s brief interruption in the outflow trend.
Pressure has also become visible in ETF holdings. Data from CheckonChain shows U.S. spot Bitcoin ETFs currently hold approximately 1.277 million BTC. While that figure remains slightly above February levels, it is still roughly 7.2% below the record high reached in October, indicating that funds have not yet recovered the Bitcoin sold during recent redemptions.
Broader market conditions have added to the pressure. Stronger-than-expected U.S. labor market data this week reduced expectations for Federal Reserve rate cuts and prompted traders to scale back risk exposure across digital assets.
The shift in sentiment intensified after BNP Paribas abandoned its previous forecast for stable monetary policy and projected three Federal Reserve rate hikes beginning in December, effectively reversing the three rate cuts delivered in 2025.
The bank cited persistent inflation pressures and a resilient labor market as reasons policymakers may need to tighten policy again, helping trigger a wave of selling that pushed Bitcoin below major technical support levels.
This bearish forecast helped trigger a wave of selling that pushed Bitcoin below major technical support levels.
Where could Bitcoin price head next?
Technical indicators suggest Bitcoin is approaching an important decision point after reaching deeply oversold conditions.
On the daily chart, BTC briefly dropped below the Murrey Math support zone near $60,000 before recovering. The daily RSI has entered oversold territory while the MACD continues to trend lower, reflecting strong bearish momentum but also increasing the probability of a relief rally.
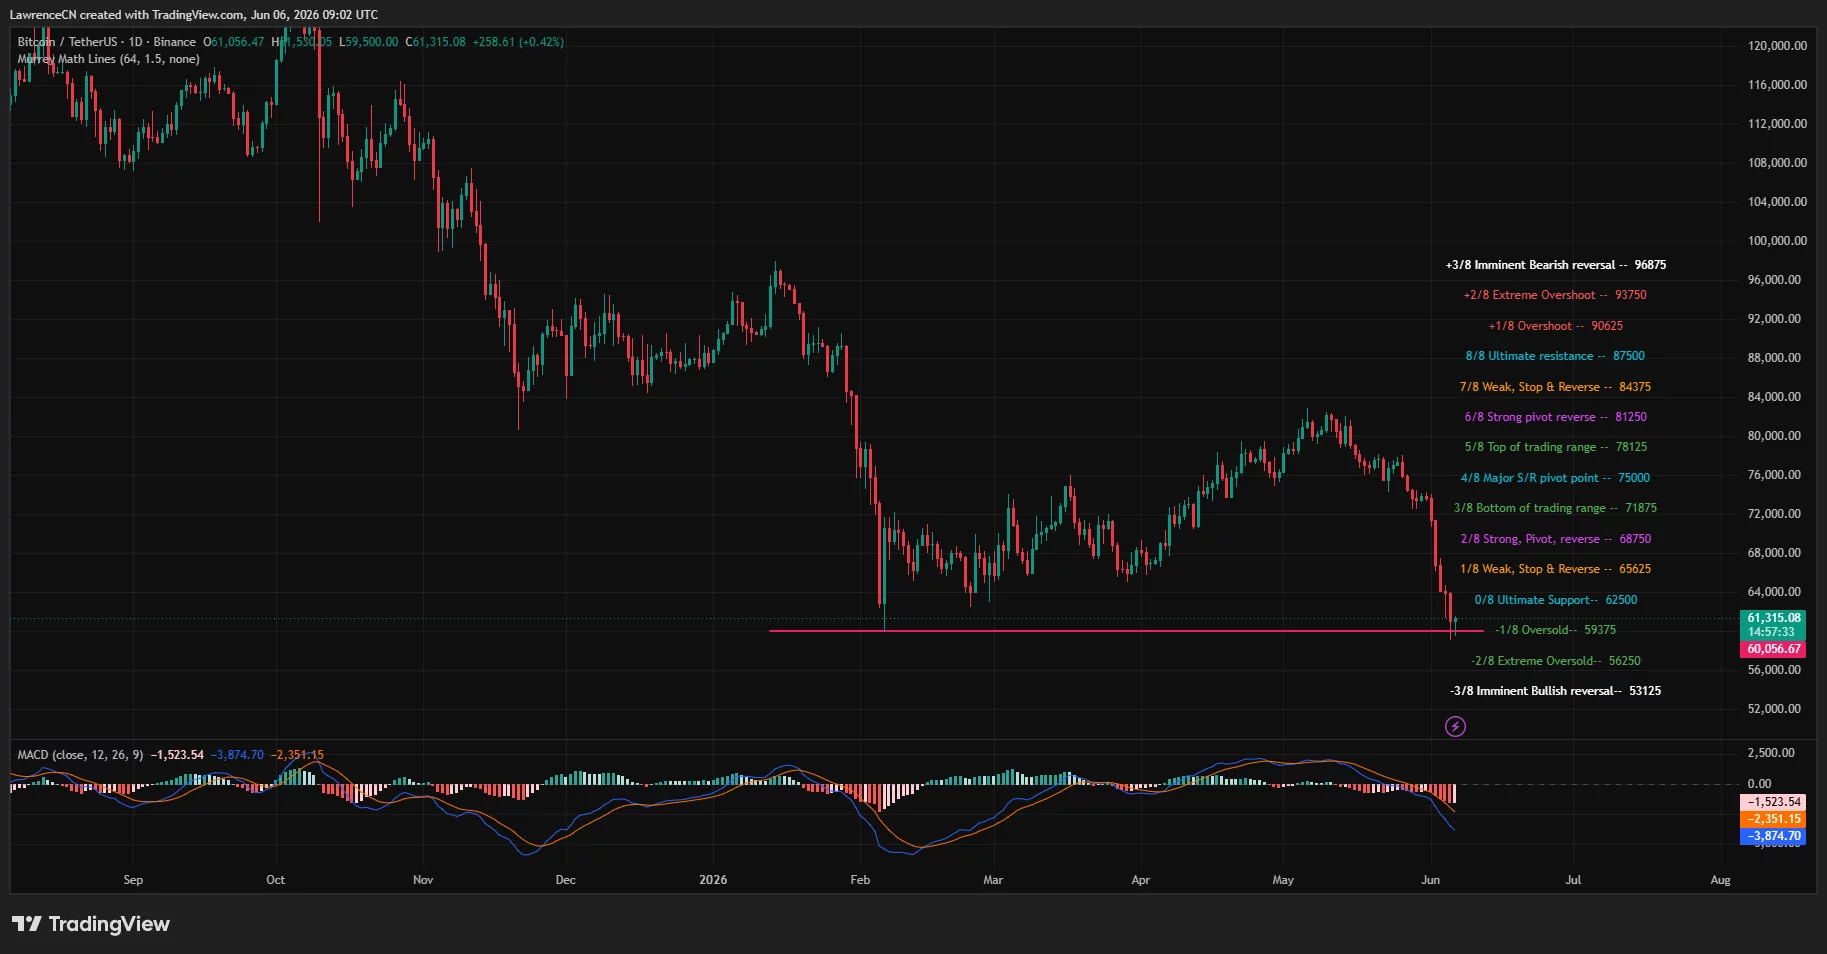
According to analyst Kamile Uray, buyers need to defend the current area to prevent a deeper decline.
According to Uray, the first resistance level sits around $67,500, followed by a broader resistance zone between $74,000 and $75,000. However, he warned that failure to hold the $60,000 area could expose Bitcoin to a deeper decline toward the $55,000-$50,000 range.
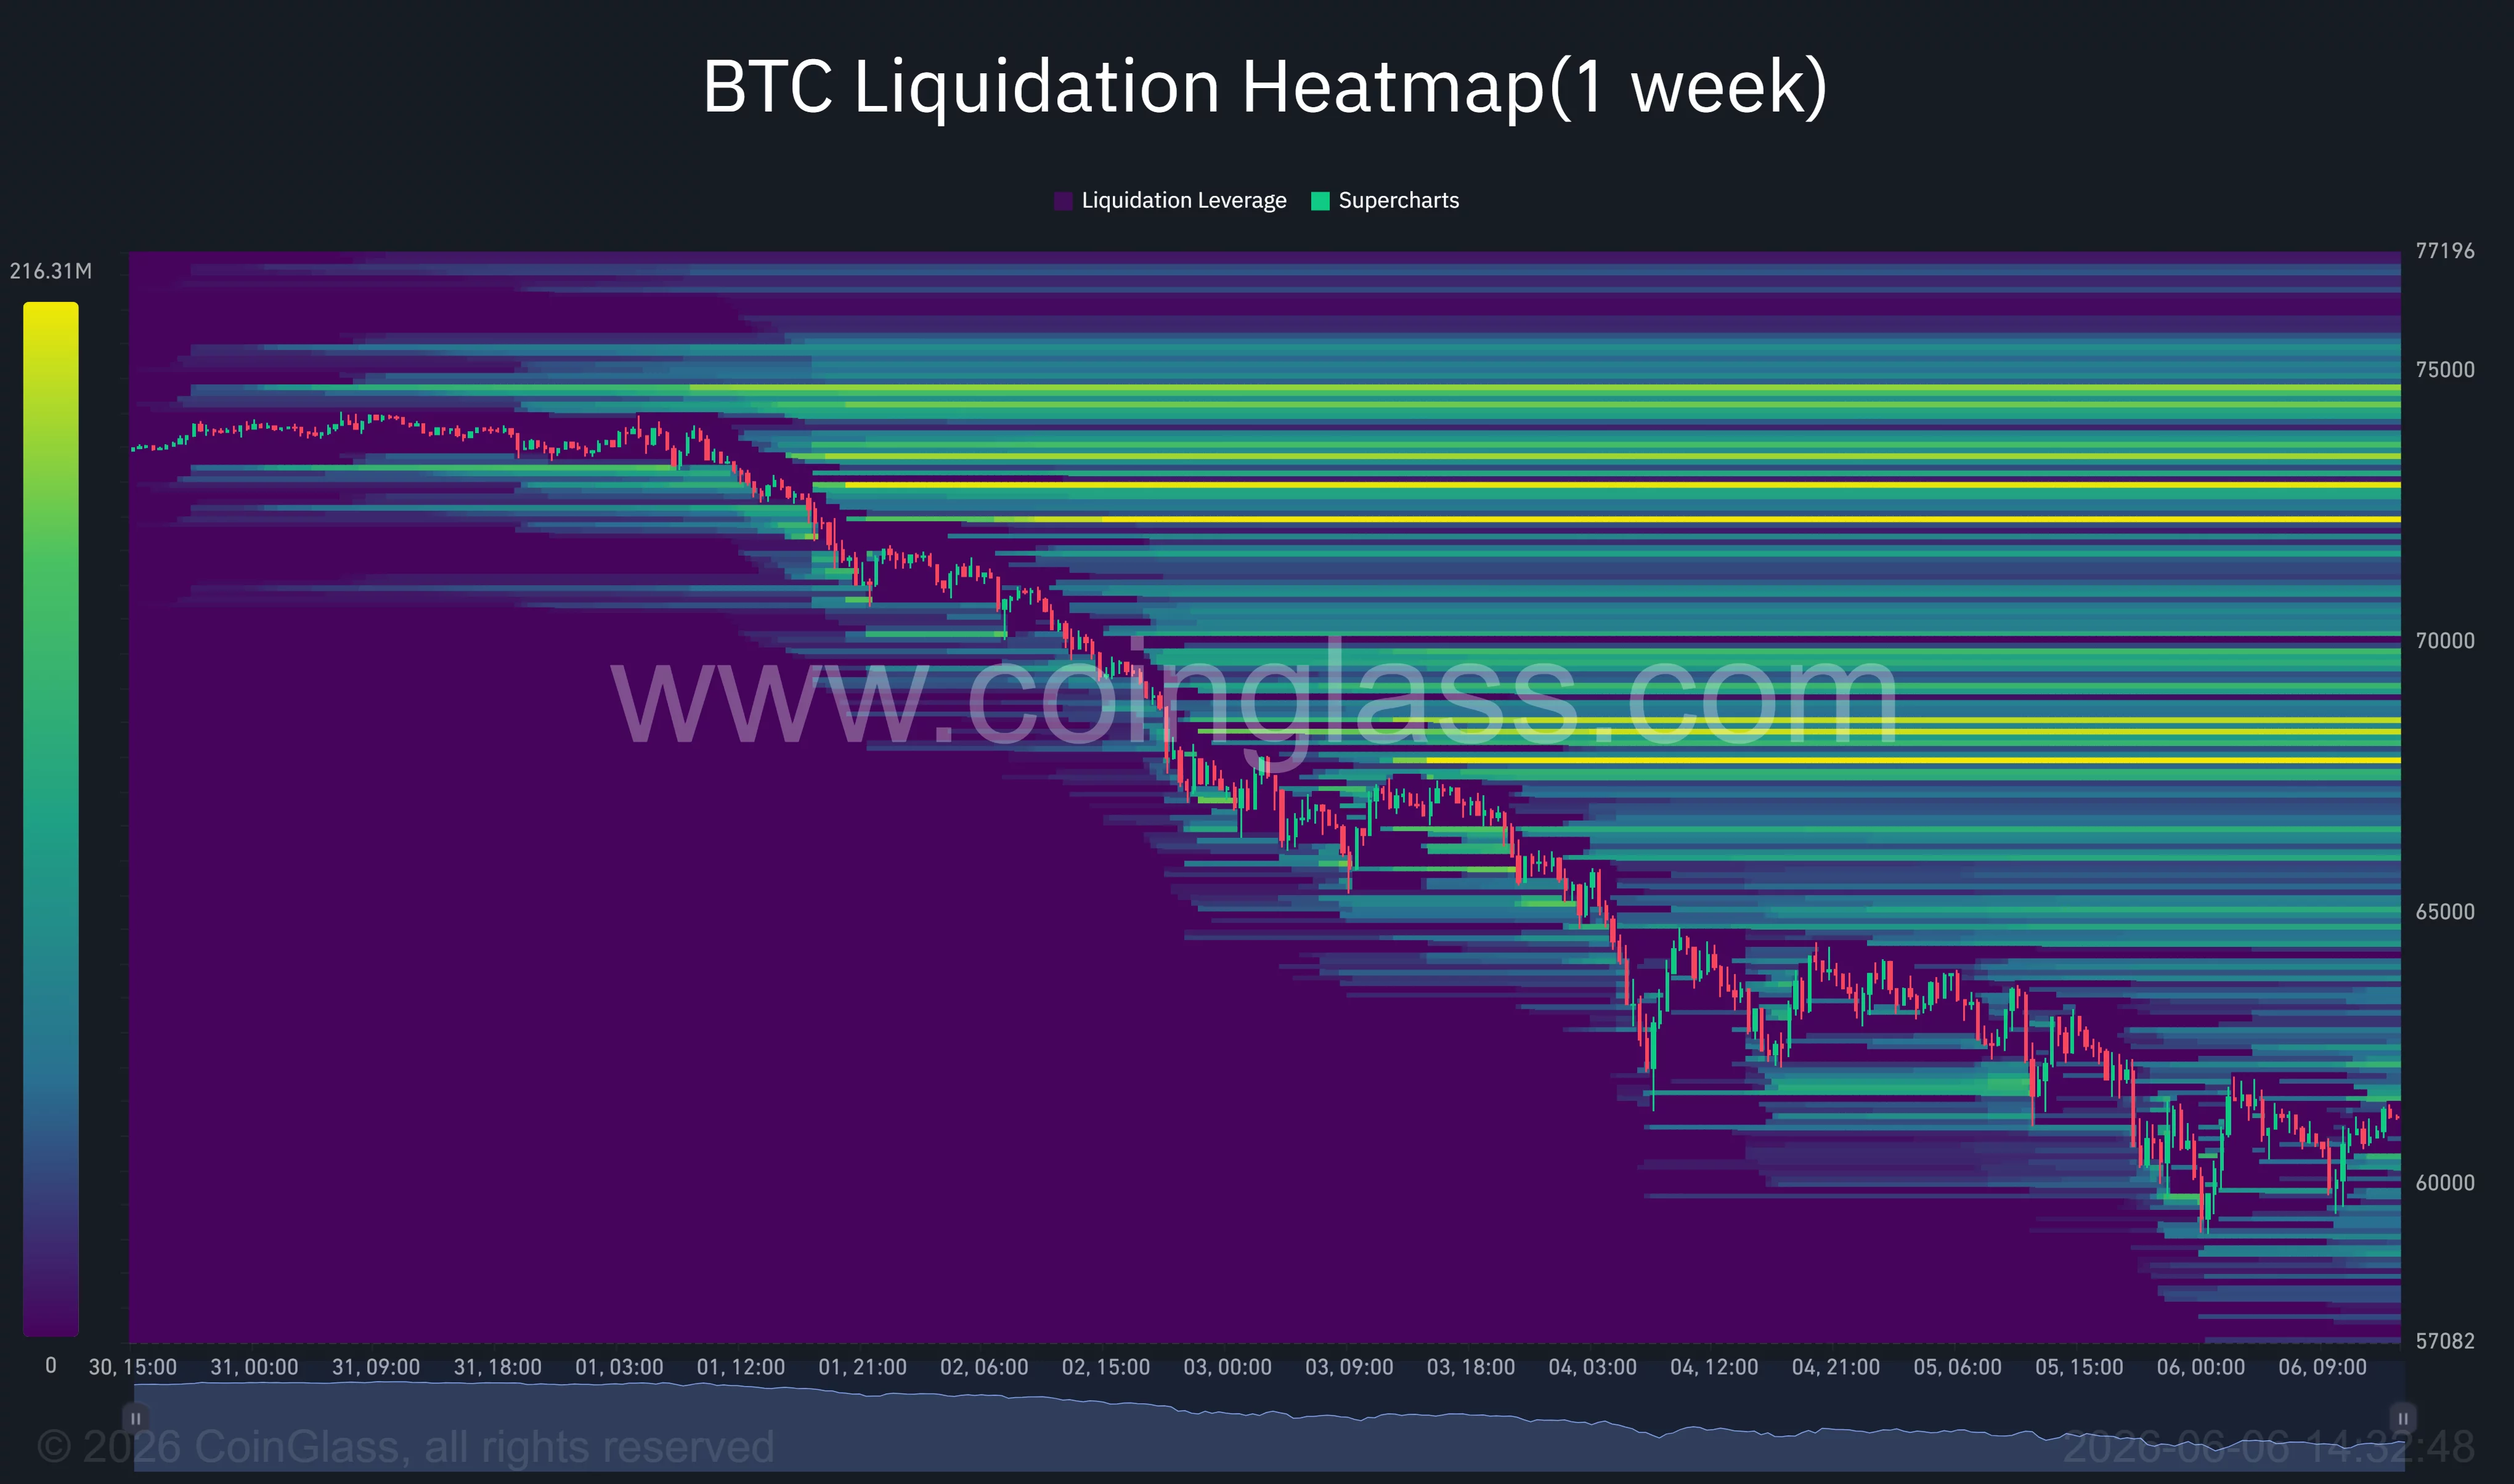
Derivatives positioning also points to heightened volatility ahead. CoinGlass liquidation heatmap data shows large clusters of leveraged positions concentrated between $67,000 and $75,000. If Bitcoin stages a recovery, those levels could become liquidation targets that accelerate upside momentum.
On the downside, analyst Ali Martinez noted that Bitcoin’s 1.0 and 0.8 MVRV pricing bands currently sit at approximately $53,900 and $43,130, respectively, levels he described as historically attractive risk-reward zones during major market corrections.
At the time of writing, Bitcoin was trading near $61,300, leaving traders closely watching whether support around $60,000 can hold as ETF outflows continue to weigh on market sentiment.
Disclosure: This article does not represent investment advice. The content and materials featured on this page are for educational purposes only.


You May Also Like

Why Polymarket Suddenly Turned Bullish On ZEC?

Republicans are weaponizing a backlash against marriage equality

Justice Department has 'gone off the rails' for Trump's 'pretzel logic': analysis


Trending News
More24/7 Live News
MoreQuick Reads
More
