

Bitcoin and Stocks Crash Together – $2.5 Trillion Wiped as Fed Flips Hawkish
The S&P 500 just erased nearly $2 trillion of market cap hours after the third strongest US jobs report in 18 months. Three days ago, the index hit an all‑time high. Today, it posted its largest single‑day drop since October 2025.
Bitcoin price is in even worse shape. Down over 50% from its record high in October 2025. Down 20% this week alone. Crypto has erased roughly $2.5 trillion in market value since October.
The Kobeissi Letter laid out the entire chain of events in a detailed thread. Let us walk through what happened, why stocks and crypto crashed together, and whether this is a buying opportunity or a time to stay on the sidelines.
The Jobs Report That Broke the Market
The headline number looked good. May non‑farm payrolls surged by 172,000 – more than double the expected 85,000. The chart attached to the report shows a massive red bar at 172, dwarfing all previous months in 2025 and early 2026.
President Trump himself commented on the decline. He said stocks should go up, not down, after such a strong jobs report.
But beneath the surface, the market does not want a strong labor market right now. Here is why.
The Fed made its first rate cut of 2025 specifically because of labor market weakness. The Fed explicitly said “downside risks to employment have risen,” and that is why they cut. It was never because inflation had reached the 2% target. It never did.
 Source: X/@KobeissiLetter
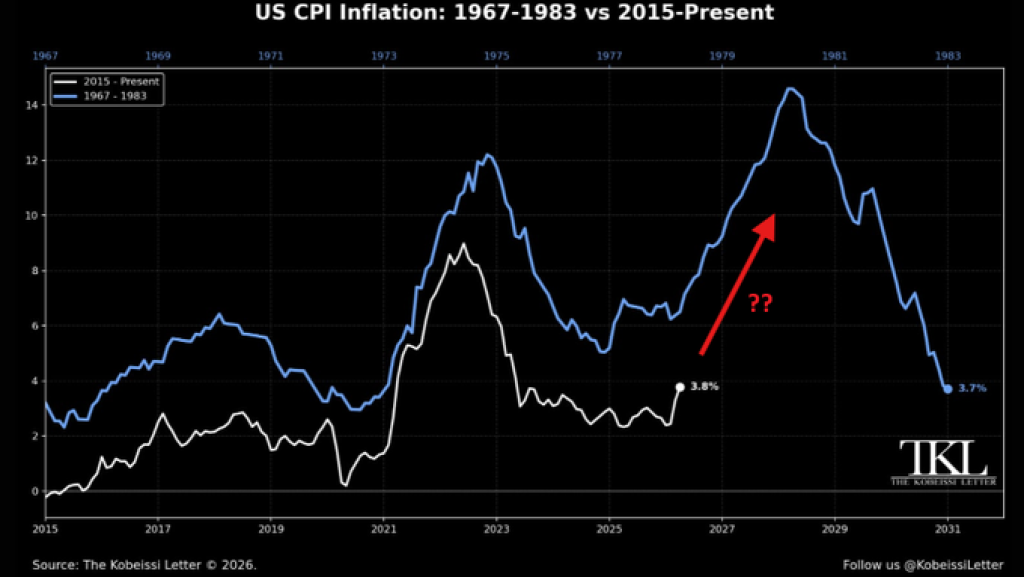
Inflation is now back up to 3.8% in the US, amplified by the Iran war and supply chain disruptions. The second chart – comparing current inflation to the 1967‑1983 period – shows a concerning pattern. The current cycle is tracking the 1970s‑style inflation rollercoaster, with a question mark at the end. Historically, that meant multiple rate hikes, not cuts.
Job Openings Surge – Rate Cut Hopes Die
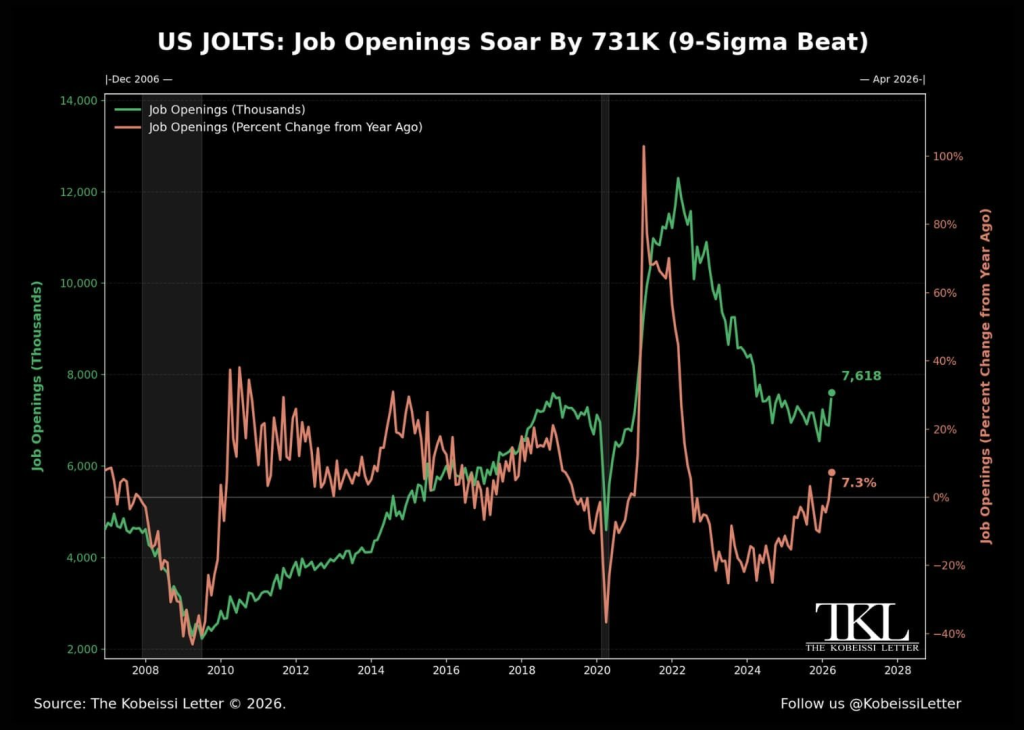
The JOLTs data released this week painted the same picture. US job openings surged by 731,000 in April when no change was expected. Available employment hit 7.6 million for the month, the highest since May 2024. The table of job openings shows a massive spike in 2022 (100% year‑over‑year) followed by a steady decline, but the April 2026 figure reversed that trend.
The bond market had held on to hopes of rate cuts because of the supposedly “weak” labor market. Today’s jobs report flipped that sentiment.
 Source: X/@KobeissiLetter
The result is the most hawkish shift in Fed expectations since post‑pandemic stimulus. The base case now shows two rate hikes by early 2027. There is even a rising 17% chance of three rate hikes by April 2027. Just months ago, markets priced up to four rate cuts in 2026 alone.
That flip from cuts to hikes crushed risk appetite across every asset class – stocks, crypto, and high‑growth tech.
Tech Equity Raises and the SpaceX IPO Add Fuel
Adding even more fuel to the fire, the Financial Times reported that Meta is considering raising “tens of billions of dollars” through a stock offering to fund AI. This would be similar to the $85 billion equity raise by Google earlier this year.
Investors are now concerned: will big tech be flooding the market with equity raises to fund AI growth? Each new offering absorbs capital that could otherwise flow into stocks or crypto.
And to top it all off, SpaceX’s $75 billion IPO is just days away. The amount of capital being raised here should not be underestimated. Funds are likely selling existing positions – including crypto and tech stocks – to make room for this IPO.
Read also: MicroStrategy Faces Record Unrealized Loss on Bitcoin Holdings
Bitcoin and Crypto Get Crushed
Bitcoin is down 53% from its October 2025 high of roughly $126,000. The week‑on‑week drop of 20% is among the worst in the past two years. Crypto total market cap has fallen from around $4.5 trillion in October to roughly $2 trillion today – a $2.5 trillion wipeout.
The correlation between Bitcoin and the S&P 500 has returned with a vengeance. Both assets sold off simultaneously because the same macro driver – rising rate expectations – hit both.
Leverage amplified the move. Over $1.5 billion in crypto liquidations occurred in 24 hours, with long positions taking the overwhelming majority of losses. Bitcoin’s open interest fell 25% in four days to $23.2 billion, its lowest since early April.
Our Take: Buying Opportunity for Bitcoin or Wait?
The Kobeissi Letter concluded that the market, up over 20% in two months, was overdue for today’s decline. That is true. But the question now is whether this overshoots on the downside.
Let us look at the signals.
Bitcoin is near $60,000, a level last seen in early 2024. The 200‑week moving average near $61,700 has historically acted as a generational support zone. The daily RSI hit 17 – the lowest reading in Bitcoin’s history. That suggests selling pressure is stretched beyond normal bear market conditions.
The “crypto is dead” crowd sentiment spiked to levels last seen at the February bottom. That signal has marked short‑term lows multiple times in the past 18 months.
For long‑term investors who missed the $30,000–$40,000 range, $60,000 Bitcoin with a 50% drawdown from highs looks attractive compared to buying near the top.
Macro conditions are now hawkish. The Fed is pricing hikes, not cuts. Inflation sits at 3.8% and could go higher if energy prices spike. The Iran war and supply chain issues remain unresolved.
Tech equity raises and the SpaceX IPO will absorb liquidity in the coming weeks. Funds are not rushing back into crypto when they can participate in a $75 billion IPO.
The jobs report was just one data point. More strong labor data could push the 2027 hike probability to 100%. And if the Fed actually hikes while inflation stays hot, crypto could see another leg down toward $49,000 – the level flagged by Kalshi traders and Peter Brandt.
Our opinion:
The $60,000 zone for Bitcoin offers a reasonable risk‑reward for long‑term holders with a horizon of 12+ months. The RSI, 200‑week MA, and sentiment signals all align with previous bottoms. But the macro headwind is real, and the bottoming process could take weeks or months.
For shorter‑term traders, waiting for confirmation – a daily close above $62,000 for the Bitcoin price or a reversal in ETF outflows – makes more sense. Catching a falling knife in a hawkish Fed environment is dangerous.
FAQs

A strong labor market removes the Fed’s reason to cut rates. Markets now price two rate hikes by early 2027 instead of four cuts, crushing risk assets.
The $60,000 zone near the 200‑week MA with a record‑low RSI has historically offered good long‑term entries. But macro conditions remain hawkish, so waiting for confirmation carries less risk.
Subscribe to our YouTube channel for daily crypto updates, market insights, and expert analysis.
The post Bitcoin and Stocks Crash Together – $2.5 Trillion Wiped as Fed Flips Hawkish appeared first on CaptainAltcoin.


You May Also Like

Gold Price Stages Resilient Recovery, Nears $4,650 Amid Market Uncertainty

Greece Unveils 15% Crypto Tax Plan With New Tax-Free Threshold

Sterling Weakens As Dollar Soars On Geopolitical Escalation And Bailey’s Cautious Stance


