

NBIS stock stalls near 208 as $2.6B stake keeps bulls in control

NBIS stock remains in a clear daily uptrend, though near-term momentum has paused around 208. A large new stake keeps the backdrop constructive as price trades near key pivots. Overall, the bias is bullish on the Daily chart, while Hourly signals temper the impulse.
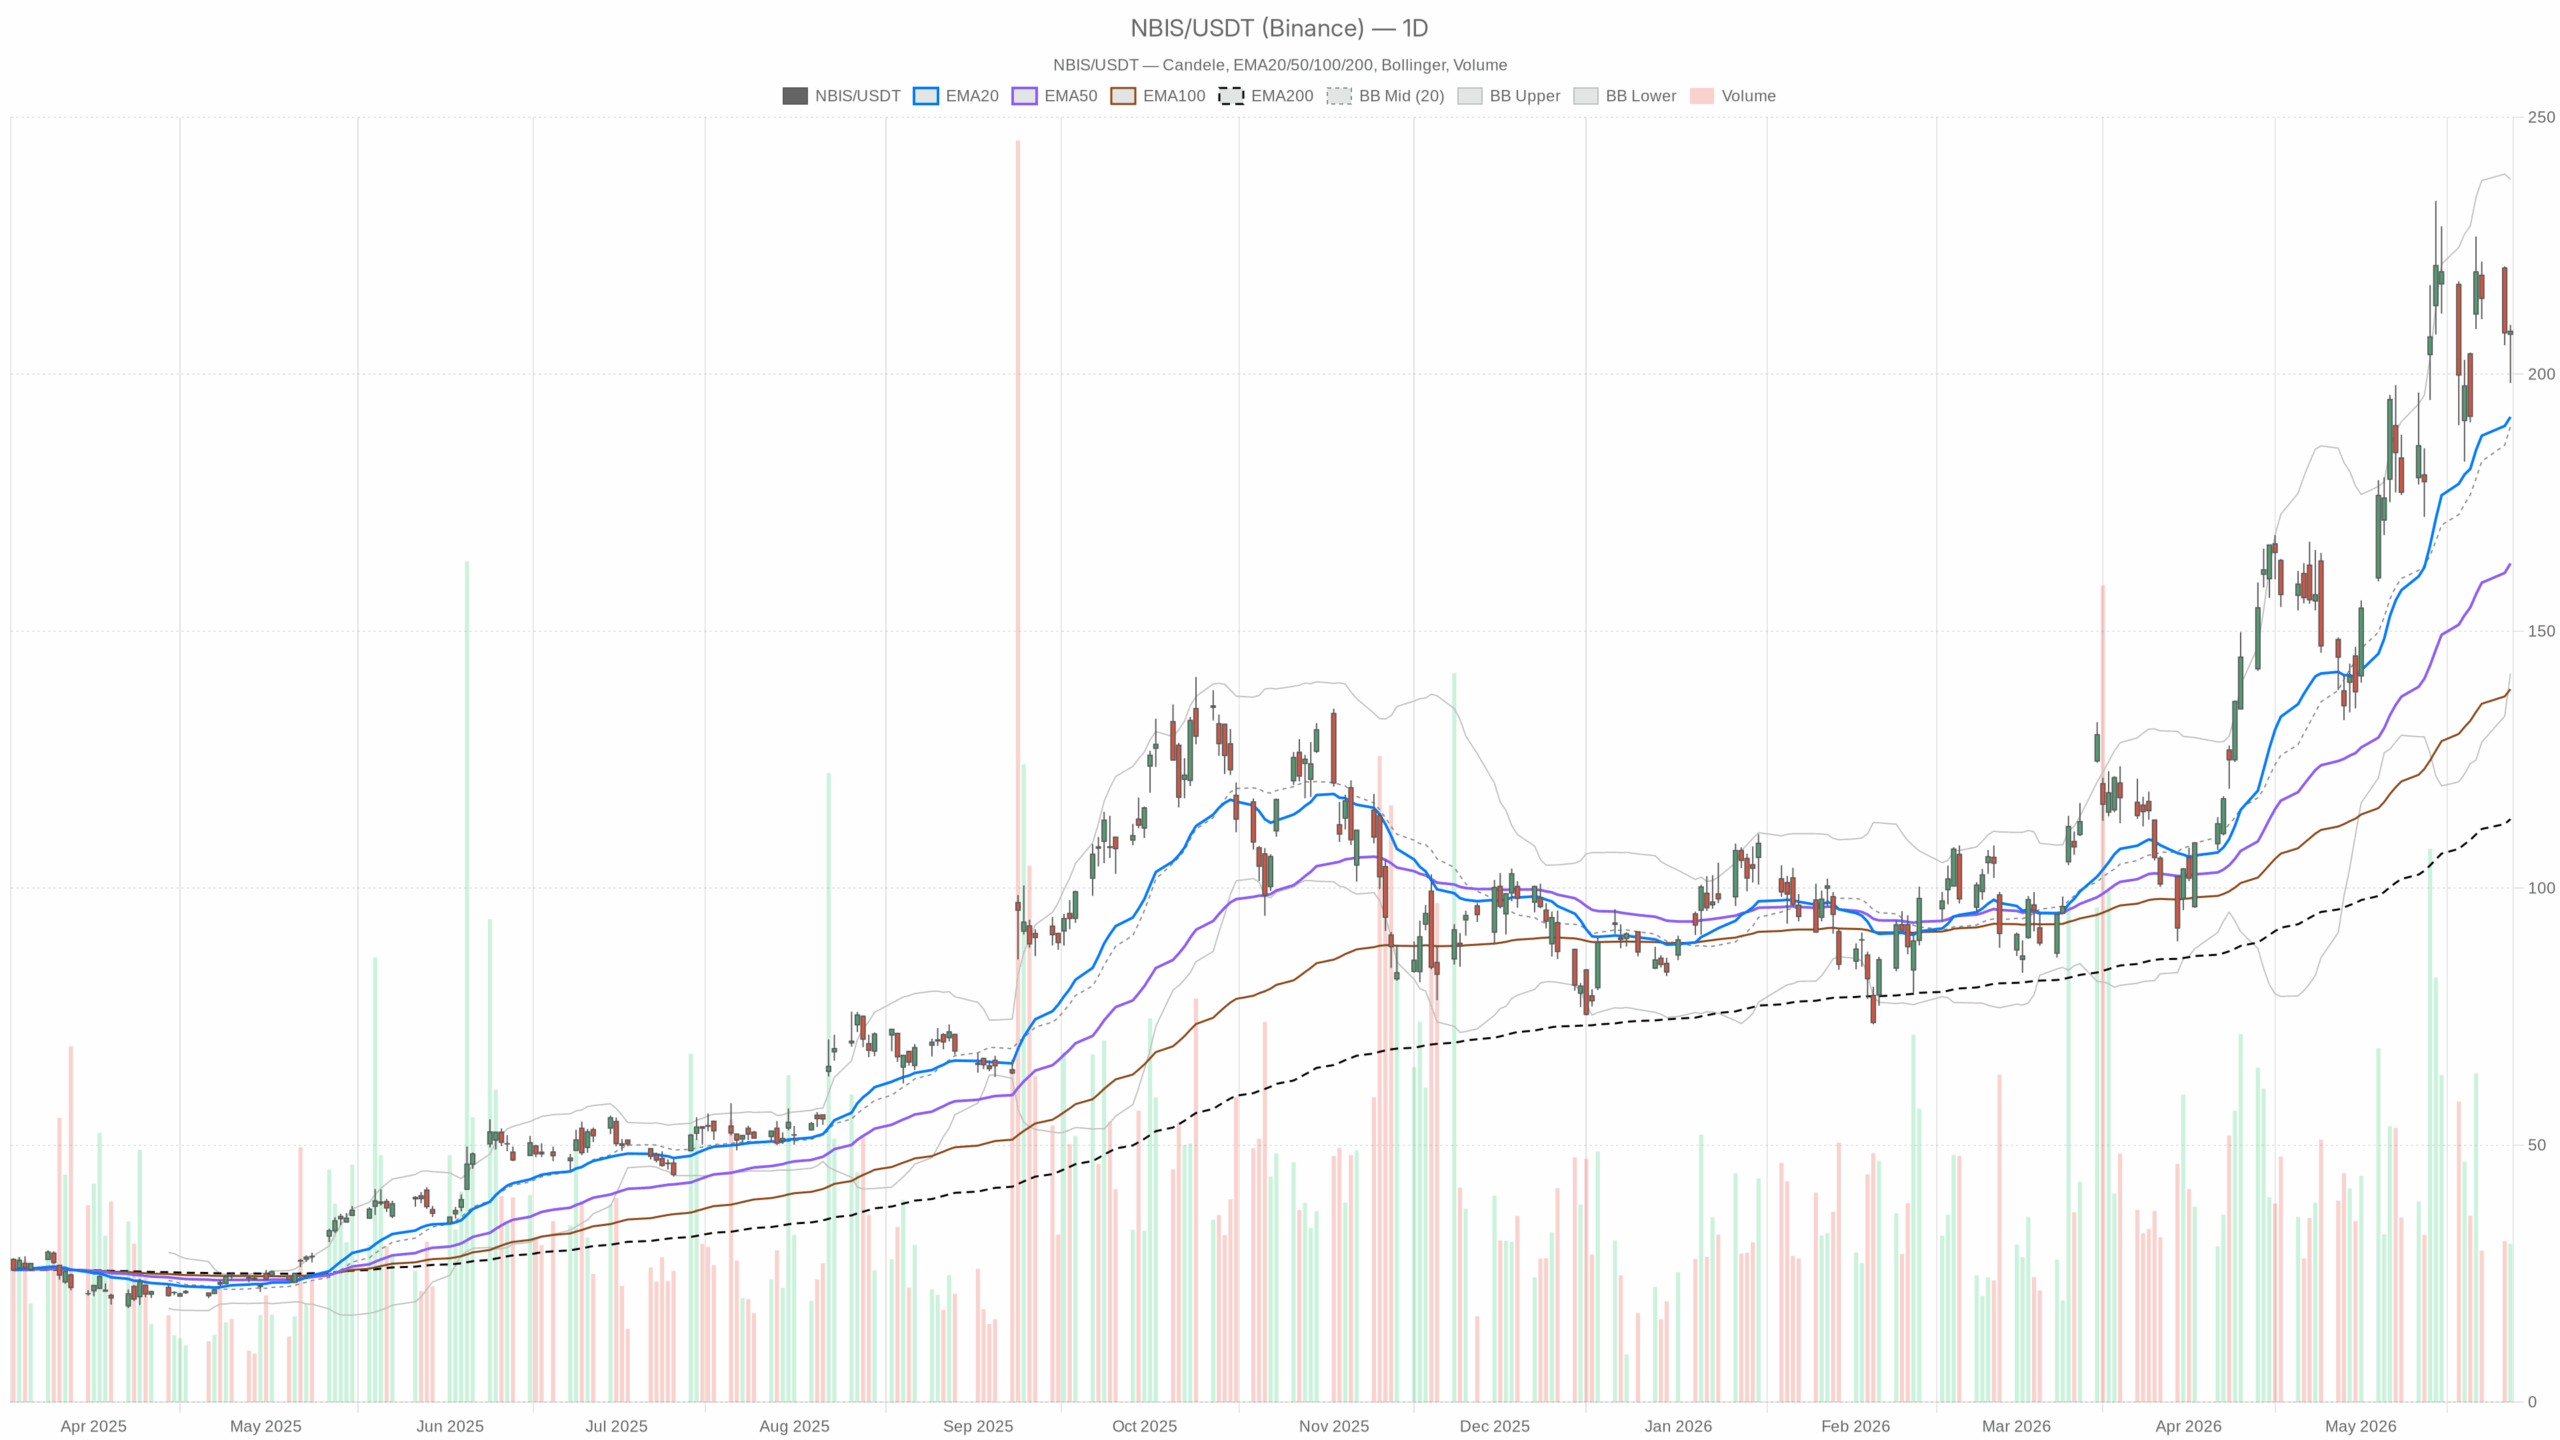 NBIS — daily chart with candlesticks, EMA20/EMA50 and volume.
NBIS stock: Daily uptrend context
Structure and moving averages
Notably, the Daily trend structure is strong. Price closed at 208.37. It sits well above the 20-day EMA 191.71, the 50-day EMA 163.19, and the 200-day EMA 113.44. This EMA alignment confirms an established uptrend.
Momentum and volatility
The Daily RSI is 60.46, signaling positive momentum without overbought pressure. Meanwhile, the Daily MACD histogram prints -0.32, which shows the trend is intact even as upside momentum cools.
Daily Bollinger Bands span 141.78–237.94 with a mid-band at 189.86. Price rides above the mid-band, leaving room before the upper band. The Daily ATR is 20.26, indicating elevated volatility and wider swings.
Key levels and sentiment
Therefore, near-term levels matter. Daily pivots flag a central pivot at 205.43, resistance at 212.54, and support at 201.25. In practice, the 201–213 band is the battleground for follow-through or pullback.
Meanwhile, the news tape tilts supportive. Leopold Aschenbrenner’s Situational Awareness LP disclosed a $2.6B stake in Nebius. Recent coverage has also highlighted growth and profitability within AI infrastructure. Fresh sponsorship can sustain a bid; however, it can also amplify volatility on headlines.
Intraday profile: Hourly and 15-minute
On the Hourly chart, conditions are more balanced. Price is 208.44 versus the 20-hour EMA 208.65 and the 50-hour EMA 207.05, keeping price near short-term averages and initial support around 207. The Hourly RSI at 49.55 is neutral, while the MACD histogram at -0.51 reflects soft intraday momentum.
Hourly Bollinger mid sits at 210.16 with price below it, so rallies are capped inside a developing range. Hourly ATR is 4.27, underscoring meaningful intraday ranges. Hourly pivots mark PP 208.28, R1 209.34, and S1 207.38. Therefore, 208 is the session decision zone within a tight 207–209 band.
At the same time, the 15-minute execution context leans modestly constructive. Price at 208.44 sits above the 15m EMA20 206.95, EMA50 207.89, and EMA200 207.50. Tactical buyers are active above these layered averages.
The 15m RSI is 55.11, showing a mild bullish bias. The 15m MACD histogram at 0.43 reflects a small positive impulse. Meanwhile, the 15m Bollinger mid is 206.29 with price above it, so buyers control the micro-tape. The 15m ATR is 1.85. The 15m pivot is 208.39 with R1 209.18 and S1 207.65, keeping the 208 handle as a live decision point.
Scenarios for NBIS stock
Bullish continuation
A sustained push above Hourly R1 209.34 would put 212.54 (Daily R1) back in play. That break would confirm buyers are regaining control. At the indicator level, an Hourly MACD cross back above signal with RSI firming through 55 would align momentum with the Daily trend.
If price then holds above the Daily pivot at 205.43 on dips, the path toward the Daily upper Bollinger near 237.94 reopens over coming sessions. Holding higher bases typically precedes trend extension. This would keep the NBIS stock forecast skewed higher within the prevailing channel.
Bearish risk case
In contrast, a decisive loss of Hourly S1 207.38 and the 15m S1 207.65, followed by pressure into the Daily S1 201.25, would hand the tape to sellers. A deepening negative Hourly MACD and RSI slipping below 45 would confirm weakening momentum.
In that case, a retest of the Daily 20‑EMA 191.71 becomes viable as volatility remains high. The elevated Daily ATR implies the downside path can be traversed quickly. That sequence would effectively invalidate the near-term bullish case.
Bottom line and levels to watch
However, the main bias stays bullish while NBIS stock holds above the Daily pivot band and the 20-day EMA. Positioning therefore favors respecting the uptrend but expecting two-way trade around 207–209 intraday. Watch 209–213 on the topside and 207–201 on the downside as the near-term map.


You May Also Like

Moody’s Assigns First-Ever Rating to Bitcoin-Backed Municipal Bond in Historic Crypto Finance Move

The two-year XRP lawsuit endgame: what’s left to resolve

Trump doesn't want the GOP to win in November — and his actions prove it



