

Ethereum price today $2,130 — bearish below $2,150; $2,116 key

In early trading, Ethereum price today sits around $2,130, lodged under every key daily moving average and hovering near the lower Bollinger Band as intraday mean reversion attempts build.
Meanwhile, broader crypto is cautious (Fear & Greed at 29, Bitcoin dominance near 58%), which typically starves ETH of leadership flows. The dominant force is defensive positioning on the daily timeframe, while short-term traders probe for bounces against nearby support.
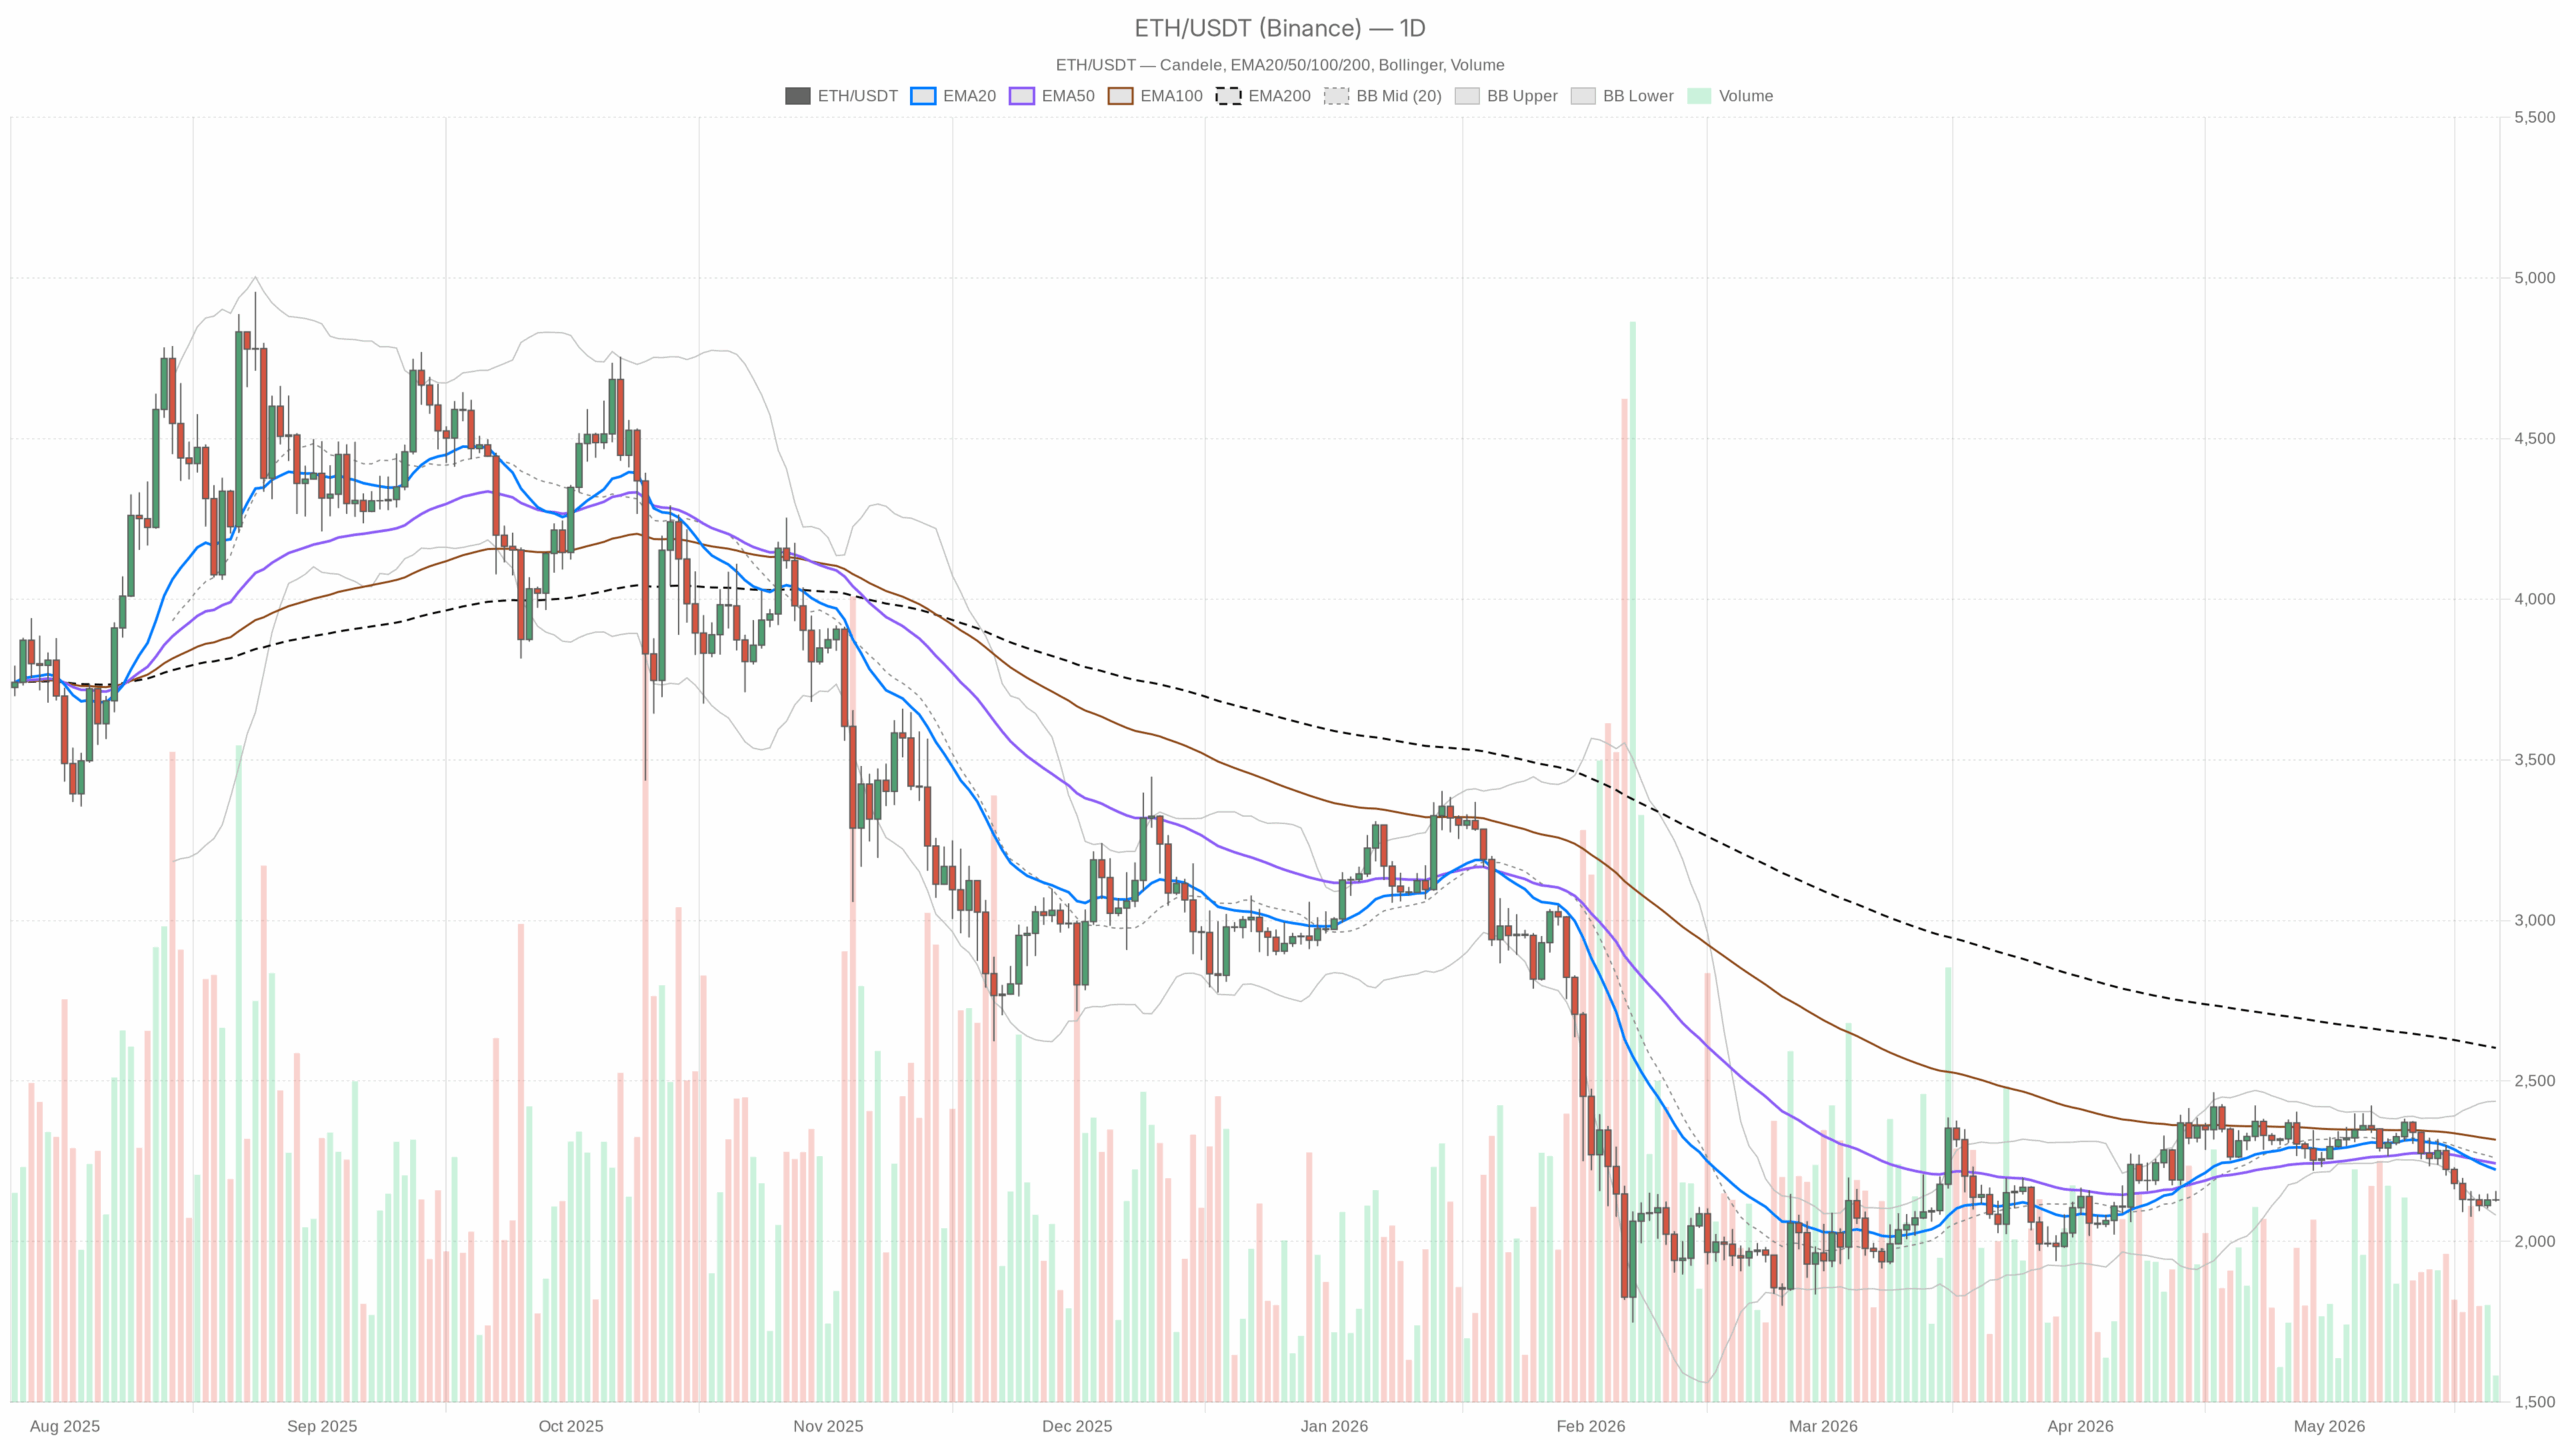 ETH/USDT — daily chart with candlesticks, EMA20/EMA50 and volume.
Top-down read
Overall, daily (macro bias): bearish. Price is below the 20/50/200-day EMAs and momentum is soft. Mean-reversion bids exist near the lower band, but the trend still has the ball.
However, 1H (tactical): neutral. ETH is oscillating around hourly pivots with flat momentum—good for two-way trade, not yet a trend reversal.
That said, 15m (execution): leaning weak but stabilizing. Price sits beneath the 15m 20/50 EMAs but clings to the 200 EMA, signaling a tug-of-war between short-covering and fresh supply.
Evidence and levels
EMAs — D1: 20-day 2,223.6; 50-day 2,243.3; 200-day 2,602.9. H1: 20/50 near 2,134/2,132; 200 at 2,181.4. M15: 20/50 ~2,136; 200 at 2,129.5. Short-term curves are flat to slightly above price, while all higher-timeframe averages loom overhead. That keeps rallies guilty until proven innocent and defines 2,181 and 2,223–2,243 as the first serious repair zones.
RSI — D1: 36.4; H1: 47.3; M15: 36.0. Moreover, higher timeframe momentum remains weak, intraday is neutral, and the execution layer still skews to sellers. This favors fades into resistance unless buyers flip H1 to sustained strength.
MACD — D1: line −43.1 under signal (hist −22.1); H1: line 2.45 under signal (hist −1.14); M15: negative. Furthermore, downside momentum persists on the daily and is wobbling intraday—think tired sellers, not eager buyers yet.
Bollinger Bands — D1: mid 2,259; lower 2,082; price near the lower quartile. Additionally, H1 band 2,123–2,148; M15 band 2,126–2,151. Price is hugging the lower halves across frames, which often invites bounces, but in a downtrend those bounces tend to stall at mid-band or upper-band tests.
ATR (volatility) — D1: 69.5; H1: 10.7; M15: 4.3. Consequently, daily range potential around $70 means a clean break of $2,116 could carry into the high $2,040s–$2,050s within a session, while reclaiming $2,150 could squeeze toward $2,180.
Pivots — D1: PP 2,137; R1 2,150; S1 2,116. Finally, H1: PP 2,128; R1 2,132; S1 2,125. M15: PP 2,129.9; R1 2,131.0; S1 2,128.9. Price is camped around these intraday pivots, making 2,125–2,132 the micro range to watch for initiative flows.
Market logic
In short, trend vs. mean reversion: The daily downtrend dominates, but proximity to the lower band keeps bounce risk alive. Momentum vs. structure: Momentum is still negative on D1; on H1/M15, structure is a tight 2,125–2,150 box where failed breaks are likely to be faded first. Risk appetite vs. defense: With fear elevated and BTC dominance high, ETH rallies may need short-covering fuel rather than fresh allocators. As a result, Ethereum price today remains driven more by trend pressure than by durable mean reversion.
Scenarios
Bullish path: Defend $2,116–$2,126 (daily S1/hourly S1 cluster), then reclaim $2,135–$2,150 (hourly EMA20/50, BB upper, and daily R1). That opens a squeeze toward $2,180 (H1 200 EMA). If momentum carries, the next repair band is $2,220–$2,245 (daily 20/50 EMAs), where sellers likely re-engage. Invalidation for bulls: a decisive break and hold below $2,116 or a daily close pushing into or under the $2,082 lower band—would indicate the bounce attempt failed.
Bearish path: Failures into $2,135–$2,150 get sold, rolling price back through $2,125 and $2,116. That exposes $2,082 (daily lower band) and, given a ~$70 ATR, sets up $2,050–$2,040 as the next magnet. Extension targets rest at the round $2,000 handle. Invalidation for bears: sustained acceptance above $2,150 intraday followed by a daily close back over ~$2,225 (20-day EMA). That would convert the move from a bounce into genuine trend repair.
How to think about positioning
Respect the daily downtrend but acknowledge the bounce risk near support. If you trade the long side, keep it tactical unless ETH is accepted above $2,150 and builds toward $2,220+. If you trade the short side, the cleaner entries are on rejections into $2,135–$2,150 or after a clean breakdown through $2,116, with the understanding that ranges remain choppy and squeezes can be sharp. Volatility is moderate, so position sizing and clear invalidations matter. Above all, align entries with your timeframe: daily bias is down, hourly is two-way, and the 15-minute is for precision around the $2,125–$2,150 box.
Bottom line: The prevailing trend is down, while intraday ranges leave room for tactical bounces. Watch $2,116–$2,150 for directional cues, $2,180 for validation, and $2,220–$2,245 for deeper repair.


You May Also Like
Bitcoin (BTC) Dips Below $67K as Markets Enter Easter Break While Oil Hits 11% Single-Day Surge

Trump's revenge tour will come back to bite him in the you-know-what

MoneyGram Becomes Tempo’s Anchor Remittance Validator in Strategic Blockchain Partnership


