Bitcoin Price Today: BTC Pulls Back to $79,340 After Weekly High of $82,000 – Is the Rally Fading?

Bitcoin is trading near $79,340 on May 8, 2026, and the weekly chart tells a story that the daily view misses. BTC opened the week at $76,960, ran hard into the $82,000 area by May 6, then spent the last two days giving it back. The weekly candle went from looking very strong to closing as a potential rejection.
That shift matters more than any single 24-hour session.
What the Weekly Chart Looks Like
The first half of the week was clean. BTC lifted off the $76,960 open on May 2, cleared $78,000, pushed through $80,000, and kept going. By May 5 to 6, price was printing around $82,000 – the highest level BTC has seen since the start of the year.
Then sellers arrived. From May 6 onwards, the chart flipped. What started as a high-volume squeeze higher turned into a steady grind back down. By May 7 to 8, BTC had given back roughly $2,700 from the weekly high and is now sitting near $79,340.
The weekly candle currently looks like a shooting star or bearish rejection wick, depending on where it closes Friday. That is not the close bulls were hoping for after a five-day rally from $76,960.
BTC/USD Chart: $80,000 Is Now the Line Between Bull and Bear
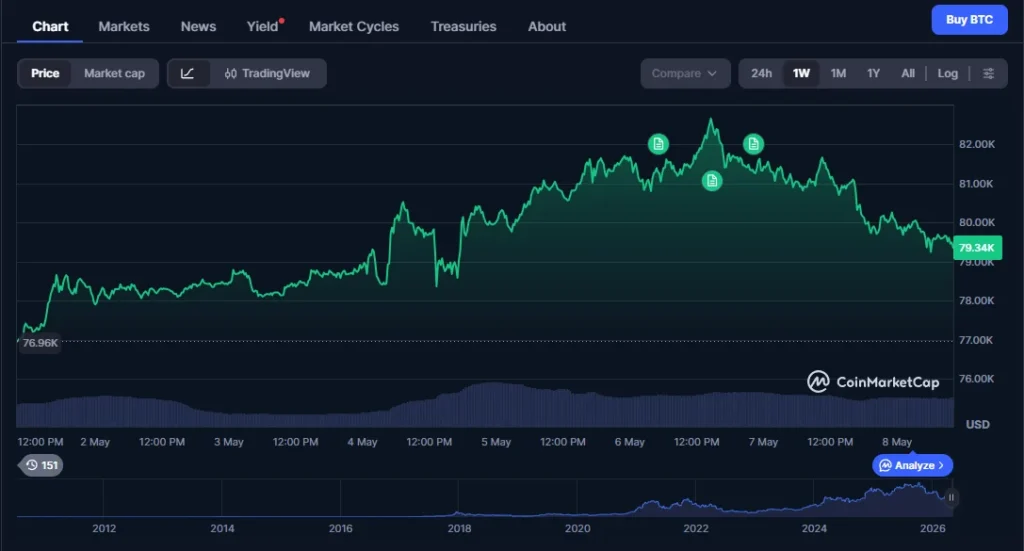 BTC/USD 1W chart showing the rally from $76,960 to $82,000 followed by a reversal to $79,340. Source: CoinMarketCap.
$80,000 is the number. BTC is currently below it, and the weekly close will determine whether this is a brief dip or something more significant.
A weekly close above $80,000 keeps the bullish case alive and frames the current pullback as normal consolidation after a strong run. From there, the next push toward $82,000 and the 200-day MA at $82,228 becomes the story again.
A weekly close below $80,000 is more concerning. It would mean BTC ran from $76,960 to $82,000 and could not hold any of the gains above the $80,000 level by end of week. That kind of rejection wick on a weekly chart typically signals more downside before the next real attempt.
Below $79,000, the next support sits near $78,000 and then $76,960, which is where the week started. A full round trip back to the open would be a significant bearish signal.
Why the Pullback Happened
The on-chain backdrop is still constructive. Exchange reserves are at a 7-year low, and whale wallets holding 1,000+ BTC net-bought 270,000 BTC over the past 30 days, the largest monthly accumulation since 2013. That kind of supply compression does not evaporate in two days.
What changed is the technical picture at $82,000. The 200-day moving average sits at $82,228, and BTC has now been rejected from that zone twice in the current run. Each failed attempt makes the level harder to crack next time. Sellers know exactly where to show up.
Approximately 47,000 BTC were withdrawn from centralized exchanges over the past 30 days, which supports the accumulation read. But short-term, the rejection from the 200-day MA is doing the work on price.
One macro factor worth watching into the weekend: the Fed Chair transition is coming May 15. Markets have been calm about it, but uncertainty around new leadership has historically weighed on risk assets in the days leading up to the announcement.
Key Levels
Support: $79,000 / $78,000 / $76,960 (weekly open) Resistance: $80,000 / $81,500 / $82,228 (200-day MA)
Bottom Line
Bitcoin ran from $76,960 to $82,000 this week and has since given back most of it, sitting at $79,340 heading into the weekly close. The rally was real, the rejection was also real.
Friday’s close is the one that counts. Above $80,000 and the week ends with the bullish structure intact. Below it and the weekly candle becomes a rejection signal that could invite more selling early next week.
Neutral to cautiously bearish short-term. The on-chain setup is fine. The chart just rejected from exactly where it was supposed to reject.
This article is for informational purposes only and does not constitute financial advice.


You May Also Like

Neutral on the Chart. Closed in the Strait.

Senate Banking Committee Nears Key Clarity Act Vote