Crypto Price Predictions for Today, May 8: XRP, Solana (SOL), Cardano (ADA)
XRP started the week under pressure, and that pressure has not let up. The token slid close to 3% yesterday, and today’s price action shows more of the same.
Solana and Cardano are not far behind, each navigating their own key levels as the broader crypto market stays cautious. Here is a breakdown of what the charts and indicators are saying today.
XRP Price Slides for a Second Day as Key Support Level Comes Into Focus
XRP price has declined for two consecutive days now, and the token is currently testing support around the $1.38 level. That level matters because a clean break below it would likely open the door to $1.36, and if bearish momentum picks up from there, $1.35 becomes a realistic target before the day is out.
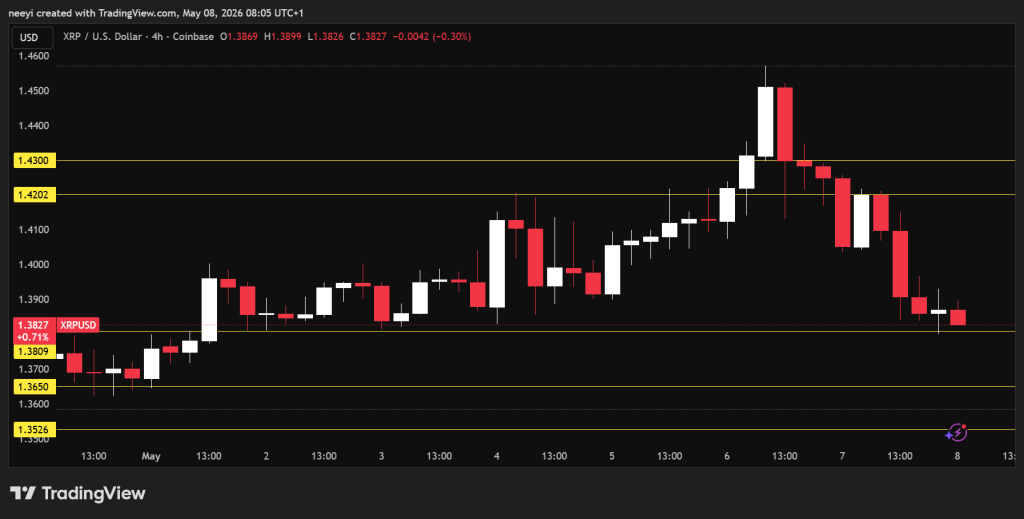 XRP Price Chart / Source: TradingView.com
The RSI reading of 31.841 is close to oversold territory, which means selling pressure has been quite heavy recently. The Stochastic Oscillator at 35.798 paints a similar picture, with the reading still leaning toward further downside.
The MACD at -0.008 is marginally negative but still a sell signal, telling us that the short-term momentum remains pointed downward. The Ultimate Oscillator at 46.626 is below the neutral 50 mark, adding another layer of confirmation that buyers are not yet in control.
| Name of Indicator | Reading | Interpretation |
|---|---|---|
| RSI (14) | 31.841 | Bearish |
| STOCH (9,6) | 35.798 | Bearish |
| MACD (12,26) | -0.008 | Bearish |
| Ultimate Oscillator | 46.626 | Bearish |
XRP Price Prediction for Today, May 8
Today’s outlook for XRP is most likely bearish to neutral. The most probable scenario is continued downside pressure unless buyers step in decisively around current levels.
The bearish scenario plays out if XRP breaks below $1.38. That would open a path toward $1.36, and a continuation of the selling momentum could push price as far down as $1.35.
The neutral scenario becomes possible if the $1.36 level holds as support. This could lead to range-bound price action between $1.36 and $1.42 for the rest of the day.
The bullish scenario is the least likely outcome today. A decisive move above $1.43 would be the level to watch, as it could open a path toward $1.45 and potentially higher. The XRP price would need to clear $1.43 convincingly before that outlook becomes credible.
Solana Price Retreats from $90 and Now Sits on a Critical Support Zone
Solana is in a broadly similar situation to XRP, though the details tell a slightly different story. The SOL price topped out near $90 and has since pulled back to trade around the $87.7 support level. A break below $87.7 would likely trigger a deeper decline toward the $86.2 area.
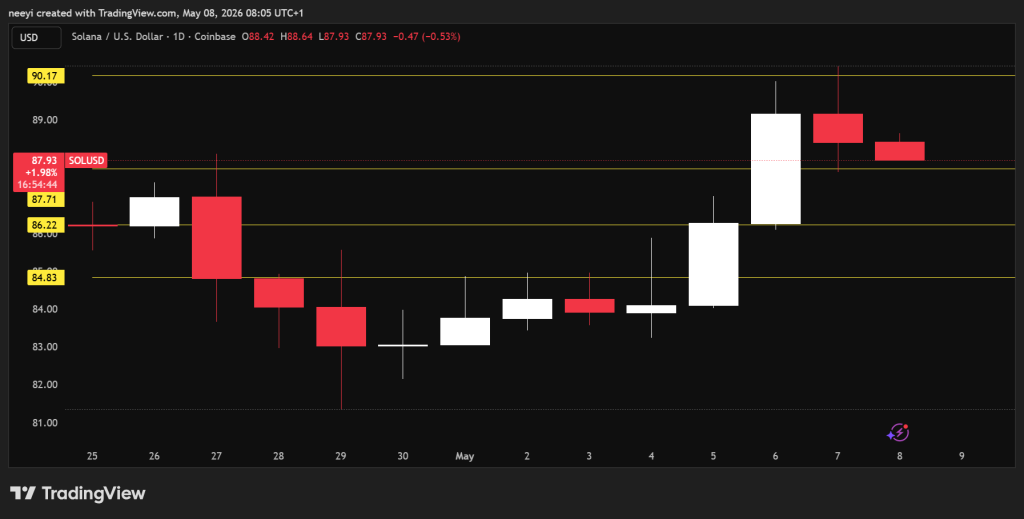 SOL Price Chart / Source: TradingView.com
The RSI at 60.21 is still above the neutral 50 level, which means the longer-term trend has not fully broken down yet. The Stochastic Oscillator at 45.201 sits in neutral territory, making it difficult to call a clear direction from that reading alone.
The MACD at 1.021 is still positive and continues to show a buy signal, suggesting that the broader momentum has not completely turned bearish. The Ultimate Oscillator at 48.778 is just below neutral and is pointing toward slight selling pressure.
| Name of Indicator | Reading | Interpretation |
|---|---|---|
| RSI (14) | 60.21 | Bullish |
| STOCH (9,6) | 45.201 | Neutral |
| MACD (12,26) | 1.021 | Bullish |
| Ultimate Oscillator | 48.778 | Bearish |
Solana (SOL) Price Prediction for Today, May 8
Today’s SOL price outlook leans bearish to neutral, with the key support at $87.7 acting as the deciding line.
The bearish scenario unfolds if Solana loses the $87.7 level. A breakdown there could take price down to $86, and a worsening of conditions could push it even lower from that point.
The neutral scenario could play out if the $87 area holds. This would likely result in a tight range between $87.9 and $90 for most of the session.
The bullish scenario requires Solana to break above $90 with conviction. A decisive close above that level would be a meaningful development and could start targeting the next major resistance zone near $93.
Cardano Price Has No Clear Direction as It Holds Between Two Key Levels
Cardano has been declining for two days, and the ADA price now sits near the $0.26 level. Unlike XRP and Solana, Cardano does not have a strong directional lean today, and the price could move either way depending on how it behaves around key technical levels.
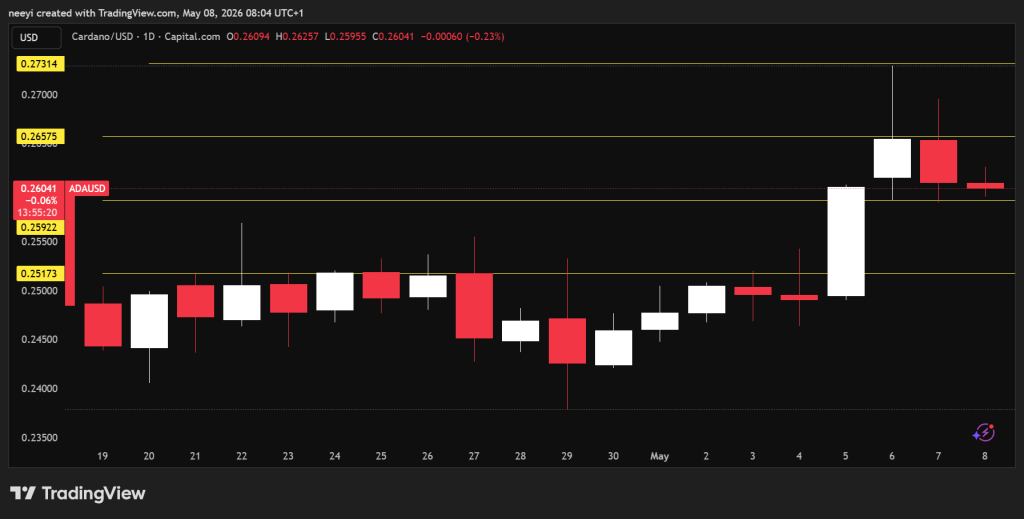 ADA Price Chart / Source: TradingView.com
The RSI at 53.845 is just above neutral, which means there is no strong conviction from buyers or sellers at this point. The Stochastic Oscillator at 25.804 is in sell territory and worth watching, as it signals that recent momentum has been to the downside.
The MACD at 0.003 is barely positive, landing as a buy signal that is too small to read with confidence. The Ultimate Oscillator at 46.253 remains below neutral, giving a mild sell signal.
Key support levels to monitor today are $0.26 and $0.251, while resistance sits at $0.266 and then $0.271.
| Name of Indicator | Reading | Interpretation |
|---|---|---|
| RSI (14) | 53.845 | Neutral |
| STOCH (9,6) | 25.804 | Bearish |
| MACD (12,26) | 0.003 | Bullish |
| Ultimate Oscillator | 46.253 | Bearish |
Cardano (ADA) Price Prediction for Today, May 8
There is no major directional bias for the ADA price today, and the outcome will depend largely on how price reacts to the surrounding support and resistance levels.
The bullish scenario plays out if Cardano manages to push above $0.266. A move above that level would set the stage for a test of the weekly high near $0.273.
The neutral scenario could emerge if neither buyers nor sellers manage to take firm control. This would likely keep ADA rangebound between $0.259 and $0.265 for the duration of the session.
The bearish scenario becomes relevant if the $0.259 level gives way. A break below that level would open the path toward the lower end of the $0.25 range, where the next meaningful support would come into play.
FAQs
Subscribe to our YouTube channel for daily crypto updates, market insights, and expert analysis.
The post Crypto Price Predictions for Today, May 8: XRP, Solana (SOL), Cardano (ADA) appeared first on CaptainAltcoin.


You May Also Like

Neutral on the Chart. Closed in the Strait.

Senate Banking Committee Nears Key Clarity Act Vote