Solana (SOL) Coils in Tight Range as Analysts Eye 30% Breakout to $100
Key Takeaways
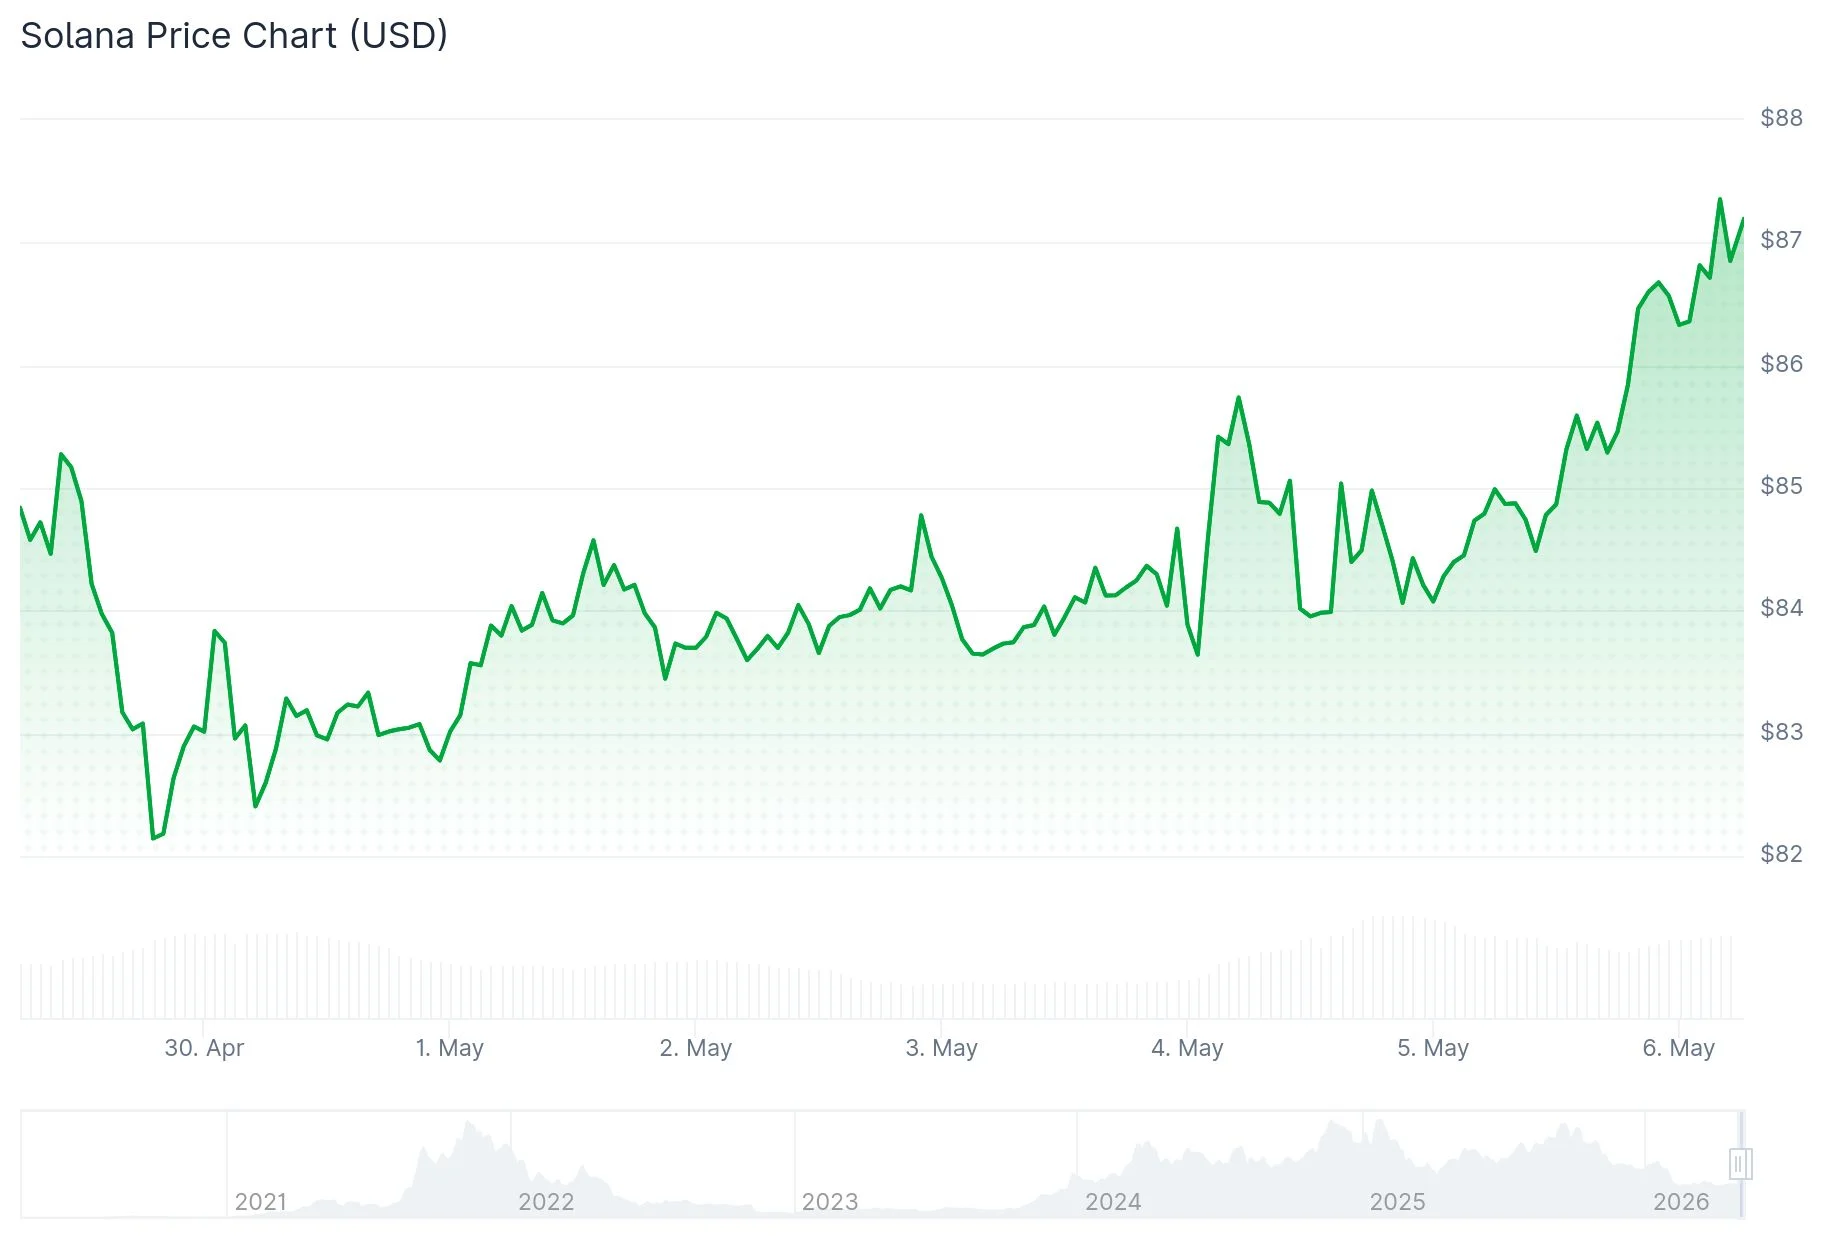
- SOL currently hovers around $85, maintaining ground above crucial $80–$85 support following extended downward pressure.
- Multiple technical analysts identify $100, $125, and $135–$145 as probable resistance targets following a confirmed breakout.
- The token has remained confined within a narrow 10% trading corridor for 90 days, prompting expectations of a 20–30% price swing upon breakout.
- Santiment blockchain metrics reveal weekly active addresses declining from 5.01M to 2.89M, though social sentiment reached its strongest reading since early 2025.
- Critical resistance lies between $90–$92; surpassing this level could trigger accelerated upward momentum, whereas falling below $80 would confirm additional downside risk.
Solana continues to trade in the $85 vicinity following an extended period of lateral movement that began after significant declines from November and January peaks. The digital asset has been confined within a constricted trading band, with demand defending the $80–$85 floor while supply consistently rejects upward probes.
 Solana (SOL) Price
Chart experts WebTrend and Ray have independently released technical assessments highlighting $100 as an achievable short-term objective should SOL clear current overhead resistance. WebTrend’s analysis identifies two rounded bottom formations — one emerging near February’s nadir and another materializing in early April — indicating diminishing selling strength at comparable price levels.
Ray’s technical framework reveals SOL consolidating within a triangle compression pattern, characterized by descending peaks and ascending troughs ranging between approximately $70 and $97. According to Ray, he anticipates SOL pushing beyond $100 “in the near future,” contingent upon a decisive penetration above the upper boundary trendline positioned around $85–$90.
A confirmed breakout through that resistance line could initially target March’s local peak near $97, followed by the psychological $100 threshold. Ray’s projection also designates $125 as a subsequent objective assuming SOL maintains elevation above the breakout region.
Technical Indicator Analysis
Analyst Daan Crypto Trades provided additional perspective, highlighting that SOL has operated within a merely 10% variance band throughout a three-month span. He observed that such extended periods of price compression commonly precede substantial directional movements and projects at least a 20–30% swing once the boundary breaks. He emphasized that the ultimate trajectory depends on which threshold fails first.
Momentum indicators reinforce the consolidation narrative. The RSI registers around 53, reflecting equilibrium market conditions. The daily MACD exhibits minimal divergence with no definitive directional bias. The 200-period EMA positioned near $112 remains substantially above current valuation, underscoring persistent long-duration bearish dynamics.
Derivatives metrics from CoinGlass indicate trading volume decreased approximately 37.88% across the previous 24-hour window, while open interest climbed 3.87%, suggesting market participants continue establishing positions despite reduced transaction activity. Aggregate liquidations during this timeframe totaled roughly $2.23 million, with short position liquidations accounting for approximately $1.84 million.
Blockchain Metrics and Network Activity
Santiment analytics demonstrate Solana’s weekly active wallet count has contracted from a February high of 5.01 million to merely 2.89 million in the latest reporting period. Santiment observed that fewer unique addresses are presently executing SOL transfers. Conversely, social sentiment metrics have surged to their most elevated reading since January. Santiment’s monitoring reveals approximately 3.2 optimistic mentions for every single pessimistic comment across social platforms including X, Reddit, and Telegram.
Primary overhead resistance establishes itself at $90–$92 according to recent price structure. Foundational support maintains near $80. Should SOL breach the lower triangle boundary around $80–$82, valuation could revisit the $70–$75 zone.
SOL’s 200-period EMA continues to rest at approximately $112, positioning current price action roughly 24% beneath that moving average threshold.
The post Solana (SOL) Coils in Tight Range as Analysts Eye 30% Breakout to $100 appeared first on Blockonomi.


You May Also Like

ekko Launches the Nature Footprint, Enabling Payment Providers to Embed Environmental Impact Insights and Action Into Everyday Spending

Ripple CEO Says CLARITY Act Is a Done Deal as Senate Prepares Markup