RaveDAO (RAVE) Price Prediction 2026, 2027-2030
- Bullish RAVE price prediction for 2026 is $9.79856 to $30.19840.
- RaveDAO (RAVE) price might reach $50 soon.
- Bearish RAVE price prediction for 2026 is $0.98234.
In this RaveDAO (RAVE) price prediction 2026, 2027-2030, we will analyze the price patterns of RAVE by using accurate trader-friendly technical analysis indicators and predict the future movement of the cryptocurrency.
|
TABLE OF CONTENTS
|
|
INTRODUCTION
|
|
|
RaveDAO PRICE PREDICTION 2026
|
|
| RAVE PRICE PREDICTION 2027, 2028-2030 |
| CONCLUSION |
| FAQ |
RaveDAO (RAVE) Current Market Status
| Current Price | $8.35 |
| 24 – Hour Price Change | 199% Up |
| 24 – Hour Trading Volume | $666.71M |
| Market Cap | $2.06B |
| Circulating Supply | 248.03M RAVE |
| All – Time High | $9.81 ( On Apr 13, 2026) |
| All – Time Low | $0.1428 (On Dec 12, 2025) |
What is RaveDAO (RAVE)
| TICKER | RAVE |
| BLOCKCHAIN | Ethereum |
| CATEGORY | DAO |
| LAUNCHED ON | October 2022 |
| UTILITIES | Staking,Governance,Ticketing,Access,Rewards |
RaveDAO (RAVE) is a Web3 project that connects blockchain technology with the global electronic music scene. It operates as a decentralized autonomous organization (DAO), allowing community members to participate in decisions and event planning. The platform focuses on hosting music festivals and immersive experiences, using NFTs for ticketing and engagement.
The RAVE token powers the ecosystem, enabling staking, governance, and access to exclusive events. It may also benefit from event revenue through buybacks and burns. RaveDAO collaborates with EDM artists and expands globally, aiming to merge entertainment with blockchain in a community-driven ecosystem.
RaveDAO 24H Technicals
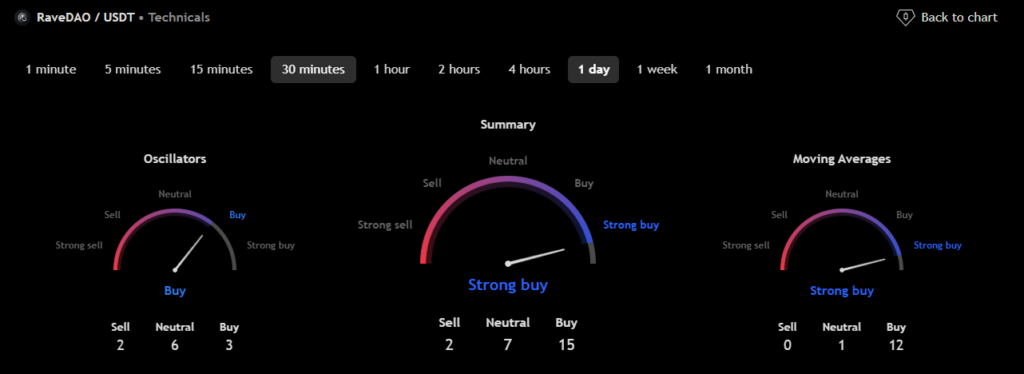 (Source: TradingView)
RaveDAO (RAVE) Price Prediction 2026
RaveDAO (RAVE) ranks 37th on CoinMarketCap in terms of its market capitalization. The overview of the RaveDAO price prediction for 2026 is explained below with a daily time frame.
In the above chart, RaveDAO (RAVE) laid out a descending channel pattern. Descending channel patterns are short-term bearish in that a stock moves lower within a descending channel, but they often form longer-term uptrends as continuation patterns. Higher prices often follow the descending channel pattern. But only after an upside penetration of the upper trend line. A descending channel is drawn by connecting the lower highs and lower lows of a security’s price with parallel trendlines to show a downward trend.
A trader could make a selling bet within a descending channel when the security price reaches its resistance trendline. An ascending channel is the opposite of a descending channel. Both ascending and descending channels are primary technical indicators followed by analysts.
At the time of analysis, the price of RaveDAO (RAVE) was recorded at $8.35. If the pattern trend continues, then the price of RAVE might reach the resistance levels of $10.326296 and $39.67285. If the trend reverses, then the price of RAVE may fall to the support level of $5.89128 and $2.59977.
RaveDAO (RAVE) Resistance and Support Levels
The chart given below elucidates the possible resistance and support levels of RaveDAO (RAVE) in 2026.
From the above chart, we can analyze and identify the following as resistance and support levels of RaveDAO (RAVE) for 2026.
| Resistance Level 1 | $9.79856 |
| Resistance Level 2 | $30.19840 |
| Support Level 1 | $3.33882 |
| Support Level 2 | $0.98234 |
RAVE Resistance & Support Levels
RaveDAO (RAVE) Price Prediction 2026 — RVOL, MA, and RSI
The technical analysis indicators such as Relative Volume (RVOL), Moving Average (MA), and Relative Strength Index (RSI) of RaveDAO (RAVE) are shown in the chart below.
From the readings on the chart above, we can make the following inferences regarding the current RaveDAO (RAVE) market in 2026.
| INDICATOR | PURPOSE | READING | INFERENCE |
| 50-Day Moving Average (50MA) | Nature of the current trend by comparing the average price over 50 days | 50 MA = $0.66055Price = $0.895138 (50MA < Price) |
Bullish/Uptrend |
| Relative Strength Index (RSI) | Magnitude of price change;Analyzing overRAVEd & overbought conditions | 99.39187 <30 = Oversold 50-70 = Neutral>70 = Overbought |
Obverbought |
| Relative Volume (RVOL) | Asset’s trading volume in relation to its recent average volumes | Below cutoff line | Weak volume |
RaveDAO (RAVE) Price Prediction 2026 — ADX, RVI
In the below chart, we analyze the strength and volatility of RaveDAO (RAVE) using the following technical analysis indicators — Average Directional Index (ADX) and Relative Volatility Index (RVI).
From the readings on the chart above, we can make the following inferences regarding the price momentum of RaveDAO (RAVE).
| INDICATOR | PURPOSE | READING | INFERENCE |
| Average Directional Index (ADX) | Strength of the trend momentum | 38.11590 | Strong Trend |
| Relative Volatility Index (RVI) | Volatility over a specific period | 99.59 <50 = Low >50 = High |
High Volatility |
Comparison of RAVE with BTC, ETH
Let us now compare the price movements of RaveDAO (RAVE) with those of Bitcoin (BTC) and Ethereum (ETH).
From the above chart, the price action of RAVE is similar to that of BTC and ETH. That is, when the price of BTC and ETH increases or decreases, the price of RAVE also increases or decreases, respectively.
RaveDAO (RAVE) Price Prediction 2027, 2028– 2030
With the help of the aforementioned technical analysis indicators and trend patterns, let us predict the price of RaveDAO (RAVE) between 2027, 2028, 2029, and 2030.
| Year | Bullish Price | Bearish Price |
| RaveDAO (RAVE) Price Prediction 2027 | $55 | $0.8 |
| RaveDAO (RAVE) Price Prediction 2028 | $60 | $0.7 |
| RaveDAO (RAVE) Price Prediction 2029 | $65 | $0.6 |
| RaveDAO (RAVE) Price Prediction 2030 | $70 | $0.5 |
Conclusion
If RaveDAO (RAVE) establishes itself as a good investment in 2026, this year will be favorable to cryptocurrency. In conclusion, the bullish RaveDAO (RAVE) price prediction for 2026 is $30.19840. Comparatively, if an unfavorable sentiment is triggered, the bearish RaveDAO (RAVE) price prediction for 2026 is $0.98234.
If the market momentum and investors’ sentiments positively elevate, then RaveDAO (RAVE) might hit $50. Furthermore, with future upgrades and advancements in the RaveDAO ecosystem, RAVE might surpass its current all-time high (ATH) of $9.81 and mark a new ATH.
FAQ
1. What is RaveDAO (RAVE)?
RaveDAO (RAVE) is a Web3 project that connects blockchain technology with the global electronic music scene.
2. Where can you purchase RaveDAO (RAVE)?
RaveDAO (RAVE) has been listed on many crypto exchanges which include Kraken, Gate.io, Binance Futures, MEXC, Coinbase, LBank, BitMart, BingX, Bitget, Bitrue
3. Will RaveDAO (RAVE) reach a new ATH soon?
With the ongoing developments and upgrades within the RaveDAO Platform, RAVE has a high possibility of reaching its ATH soon.
4. What is the current all-time high (ATH) of RaveDAO (RAVE)?
On April 13, 2026, RAVE reached its new all-time high (ATH) of $9.81.
5. What is the lowest price of RaveDAO (RAVE)?
According to CoinMarketCap, RAVE hit its all-time low (ATL) of $0.1428 on December 12, 2025.
6. Will RaveDAO (RAVE) reach $50?
If RaveDAO (RAVE) becomes one of the active cryptocurrencies that maintains a bullish trend, it might rally to hit $50 soon.
7. What will be the RaveDAO (RAVE) price by 2027?
RaveDAO (RAVE) price is expected to reach $55 by 2027.
8. What will be the RaveDAO (RAVE) price by 2028?
RaveDAO (RAVE) price is expected to reach $60 by 2028.
9. What will be the RaveDAO (RAVE) price by 2029?
RaveDAO (RAVE) price is expected to reach $65 by 2029.
10. What will be the RaveDAO (RAVE) price by 2030?
RaveDAO (RAVE) price is expected to reach $70 by 2030.
Top Crypto Predictions
MANTRA (OM) Price Prediction
Algorand (ALGO) Price Prediction
XRP (XRP) Price Prediction
Disclaimer: The opinion expressed in this article is solely the author’s. It does not represent any investment advice. TheNewsCrypto team encourages all to do their own research before investing.


You May Also Like

Crypto Hack: Drift Protocol Drained Over $200M in Private Key Breach

The Chemistry of UV Resistance: How Titanium Dioxide Protects Against the California Sun