

Inflation Warning: Fed’s Goolsbee Charts Show Price Pressures Could Roar Back
BitcoinWorld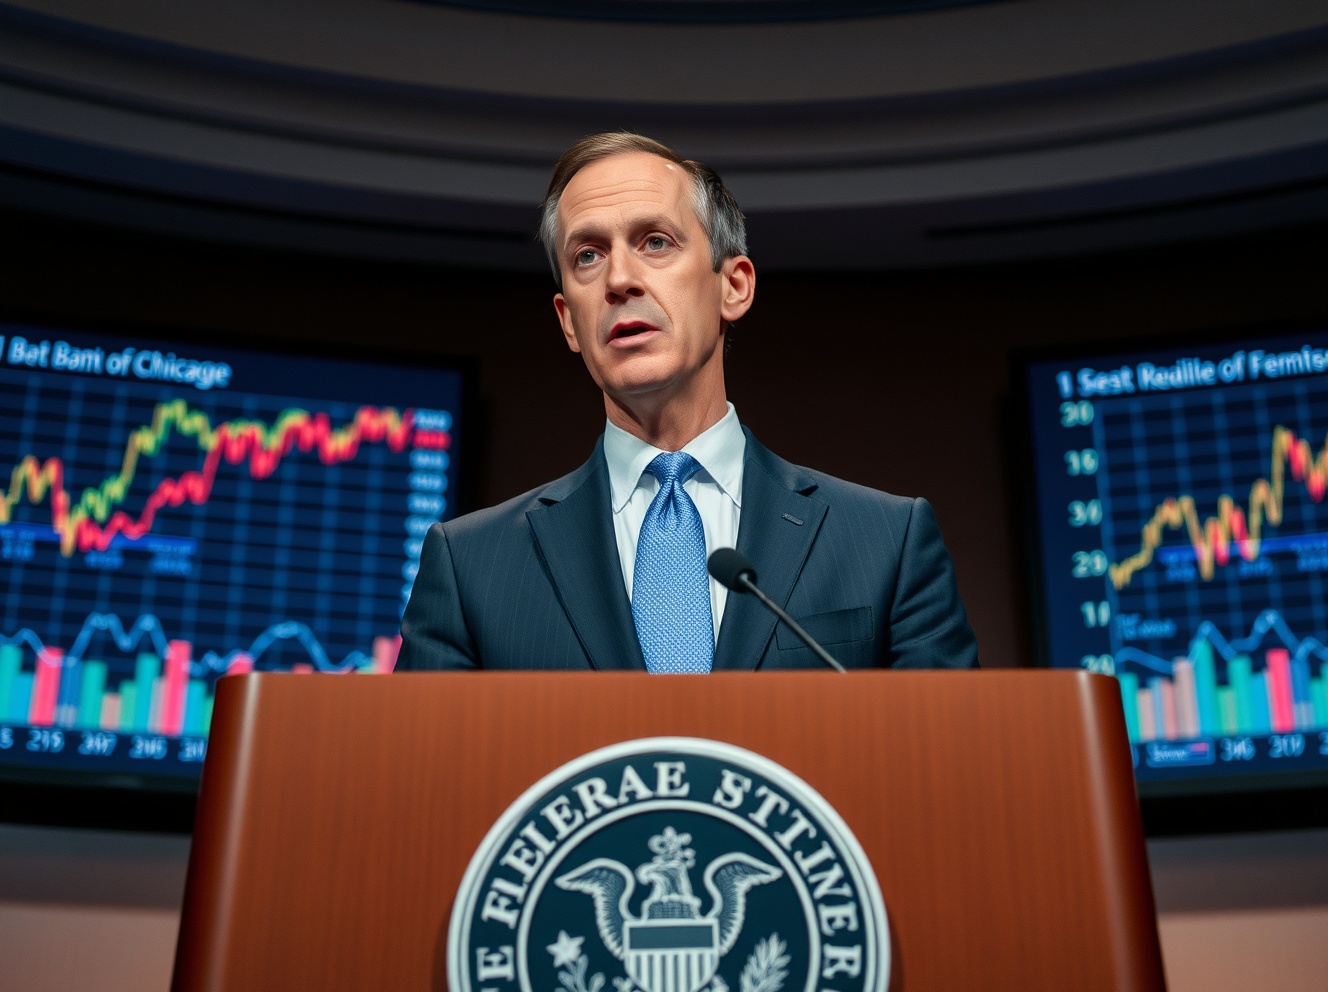
Inflation Warning: Fed’s Goolsbee Charts Show Price Pressures Could Roar Back
Federal Reserve Bank of Chicago President Austan Goolsbee delivered a stark inflation warning this week, presenting detailed economic charts suggesting price pressures could accelerate again if policymakers ease monetary restraint prematurely. Speaking at the Economic Club of Chicago on Tuesday, March 18, 2025, Goolsbee emphasized the complex balancing act facing the Federal Open Market Committee as it navigates the final stages of its inflation fight.
Goolsbee’s Inflation Warning Analysis
Goolsbee’s presentation featured multiple economic indicators showing persistent underlying inflation pressures. The Chicago Fed president specifically highlighted services inflation excluding housing, which has remained stubbornly elevated despite overall Consumer Price Index improvements. Furthermore, he pointed to wage growth trends that continue to outpace the Fed’s 2% inflation target, creating potential for sustained price increases.
Historical data comparisons revealed concerning patterns. For instance, Goolsbee displayed charts showing how previous inflation cycles experienced secondary surges when central banks relaxed policies too quickly. These visual comparisons provided compelling evidence for maintaining current restrictive monetary settings. The presentation included detailed breakdowns of shelter costs, medical services, and education expenses—all categories showing limited disinflation progress.
Economic Charts Reveal Underlying Pressures
The economic charts presented by Goolsbee offered several critical insights. First, they showed core Personal Consumption Expenditures inflation remaining above target. Second, they revealed labor market tightness persisting despite recent unemployment rate increases. Third, the charts demonstrated how supply chain improvements have largely run their course, removing a key disinflationary force.
Key data points from the presentation included:
- Services inflation: Remained at 4.2% year-over-year
- Wage growth: Averaging 4.5% across multiple measures
- Shelter costs: Showing only gradual moderation
- Inflation expectations: Business surveys indicating continued price increases
These indicators collectively suggested that underlying inflation dynamics remain concerning. Goolsbee emphasized that while headline numbers have improved, the composition of remaining inflation is particularly sticky.
Monetary Policy Implications
The charts directly informed Goolsbee’s policy recommendations. He argued for maintaining the current federal funds rate range of 4.75-5.00% through at least mid-2025. Additionally, he suggested the Fed should continue reducing its balance sheet at the current pace. The data supported a cautious approach to any policy normalization, with particular attention to real interest rates remaining positive.
Historical analysis within the presentation showed that premature easing in the 1970s led to renewed inflation surges. Goolsbee contrasted this with the successful disinflation of the early 1980s, when the Fed maintained restrictive policy until inflation was decisively defeated. The comparison highlighted the risks of declaring victory too early in the current cycle.
Market Reactions and Economic Impacts
Financial markets responded immediately to Goolsbee’s comments. Treasury yields rose across the curve, particularly in the 2-5 year range most sensitive to monetary policy expectations. Equity markets showed mixed reactions, with rate-sensitive sectors underperforming. The dollar strengthened against major currencies as investors priced in more sustained Fed hawkishness.
The economic implications are significant for multiple sectors:
| Sector | Potential Impact |
|---|---|
| Housing | Higher mortgage rates for longer duration |
| Consumer Spending | Continued pressure on discretionary categories |
r>
| Business Investment | Delayed capital expenditure decisions |
| Labor Markets | Gradual cooling but persistent tightness |
These impacts would extend through 2025 and potentially into 2026 if the Fed maintains its restrictive stance. The housing market faces particular challenges, with affordability concerns likely to persist.
Expert Perspectives on the Data
Several economists have analyzed Goolsbee’s chart presentation. Former Fed Vice Chair Alan Blinder noted the importance of distinguishing between temporary improvements and sustained disinflation. Similarly, Harvard economist Jason Furman emphasized that services inflation has proven particularly resistant to monetary policy. These expert views reinforce Goolsbee’s cautious approach.
The data presentation aligns with recent research from the Federal Reserve Board staff. Their models suggest inflation could reaccelerate if unemployment doesn’t rise sufficiently. This research, referenced in recent FOMC minutes, provides additional context for Goolsbee’s warnings. The convergence of multiple analytical approaches strengthens the case for policy patience.
Historical Context and Future Projections
Goolsbee placed current inflation dynamics in historical context. He compared the post-pandemic inflation surge to previous episodes, noting both similarities and differences. The unique aspects include unprecedented fiscal stimulus, global supply chain disruptions, and changing labor force participation patterns. These factors complicate the inflation fight and require nuanced policy responses.
Looking forward, the Fed faces several critical decisions. The timing of any rate cuts will depend on incoming data, particularly on services inflation and wage growth. Balance sheet reduction will continue, though the pace may eventually slow. Communication challenges remain significant as the Fed manages expectations while maintaining flexibility.
Conclusion
Austan Goolsbee’s inflation warning, supported by detailed economic charts, highlights the persistent challenges facing monetary policymakers. The data clearly shows underlying price pressures that could accelerate if restraint eases prematurely. This analysis suggests the Federal Reserve will maintain restrictive policy through 2025, with significant implications for financial markets and the broader economy. The inflation warning serves as a reminder that the final stage of disinflation often proves most difficult.
FAQs
Q1: What specific charts did Goolsbee reference in his inflation warning?
Goolsbee highlighted charts showing services inflation excluding housing, wage growth trends, shelter costs, and inflation expectations from business surveys. These indicators collectively demonstrated persistent underlying price pressures.
Q2: How does Goolsbee’s view compare to other Fed officials?
Goolsbee represents the cautious wing of the FOMC, emphasizing inflation risks over growth concerns. His position aligns closely with Chair Powell’s recent comments but may be more hawkish than some regional bank presidents focused on employment goals.
Q3: What would cause inflation to “roar back” according to Goolsbee?
Premature interest rate cuts, combined with persistent wage growth and services inflation, could reignite broader price pressures. Supply chain vulnerabilities and fiscal policy could also contribute to renewed inflation.
Q4: How long does Goolsbee suggest maintaining current interest rates?
Based on his analysis, Goolsbee implies maintaining restrictive policy through at least mid-2025, with any easing contingent on clear evidence of sustained disinflation across multiple indicators.
Q5: What sectors are most vulnerable if inflation reaccelerates?
Interest-sensitive sectors like housing and autos would face continued pressure. Consumers would experience reduced purchasing power, particularly for discretionary items. Financial markets would likely see increased volatility across asset classes.
This post Inflation Warning: Fed’s Goolsbee Charts Show Price Pressures Could Roar Back first appeared on BitcoinWorld.


You May Also Like

Chinese automaker expands South Africa production

Here’s Why The Dogecoin Price Could See Big Gains Soon


