

Markets await Fed’s first 2025 cut, experts bet “this bull market is not even close to over”
Will the Fed’s first rate cut of 2025 fuel another leg higher for Bitcoin and equities, or does September’s history point to caution?
- The Fed is widely expected to announce its first rate cut of 2025, with markets pricing in a 25bp move.
- Bitcoin is trading near $116,500 and Ethereum near $4,500, supported by declining exchange balances and record ETF inflows.
- Historical patterns show September as a weak month for equities and crypto, while tariffs and inflation add fresh macro risks.
- Anthony Pompliano argues the bull market has much further to run, while other analysts warn of seasonal volatility and short-term pullbacks.
First rate cut of 2025 set against a fragile backdrop
The Federal Reserve is widely expected to announce its first rate cut of 2025 at the conclusion of its Sep. 16–17 meeting. Markets are pricing in a 25 basis-point reduction, which would bring the federal funds rate down to a range of 4.00% to 4.25%.
A larger 50 basis-point cut is seen as unlikely, but attention will be on the Fed’s updated “dot plot,” which will indicate how many cuts policymakers expect through the rest of 2025 and the likely path of rates into 2026.
The case for easing has been building for months. Job growth has slowed noticeably. In August 2025 nonfarm payrolls rose by only 22,000, one of the weakest monthly gains in years. The unemployment rate also ticked up to 4.3% from 4.2% in July, close to its highest level since 2021.
Housing data points to softer momentum as well. The 30-year fixed mortgage rate fell to 6.39% in early September, its lowest level since October 2024. That decline spurred a pickup in refinancing activity and showed how higher borrowing costs have curbed demand.
Inflation is still above target but shows signs of stabilizing. Consumer prices in August 2025 rose 2.9% year-over-year compared with 2.7% in July, while core inflation held steady at 3.1%. On a monthly basis, headline CPI increased 0.4% and core CPI rose 0.3%.
These figures remain above the Fed’s 2% goal but are well below the peaks of 2022 and 2023, when headline inflation ran above 6%. That gap gives the Fed some room to cut without immediately risking a rebound in price pressures.
These developments shape expectations for how crypto markets may react once the Fed delivers its first cut of the year.
Bitcoin and Ethereum climb as investors bet on easing
Crypto markets have been gradually advancing in the days leading up to the Fed meeting, reflecting expectations of a rate cut.
Bitcoin (BTC) is trading close to $116,500, up about 3.5% over the past week and approaching its August peak above $124,000.
Ethereum (ETH) has gained nearly 4% in the same period, trading near $4,500, though it remains more than 9% below its August all-time high of $4,950.
On-chain data shows that the amount of Bitcoin available for immediate sale has been declining. Since Sep. 1, balances on exchanges have dropped from about 2.5 million BTC to 2.45 million. This means more than 50,000 BTC have been moved off exchanges in just over two weeks.
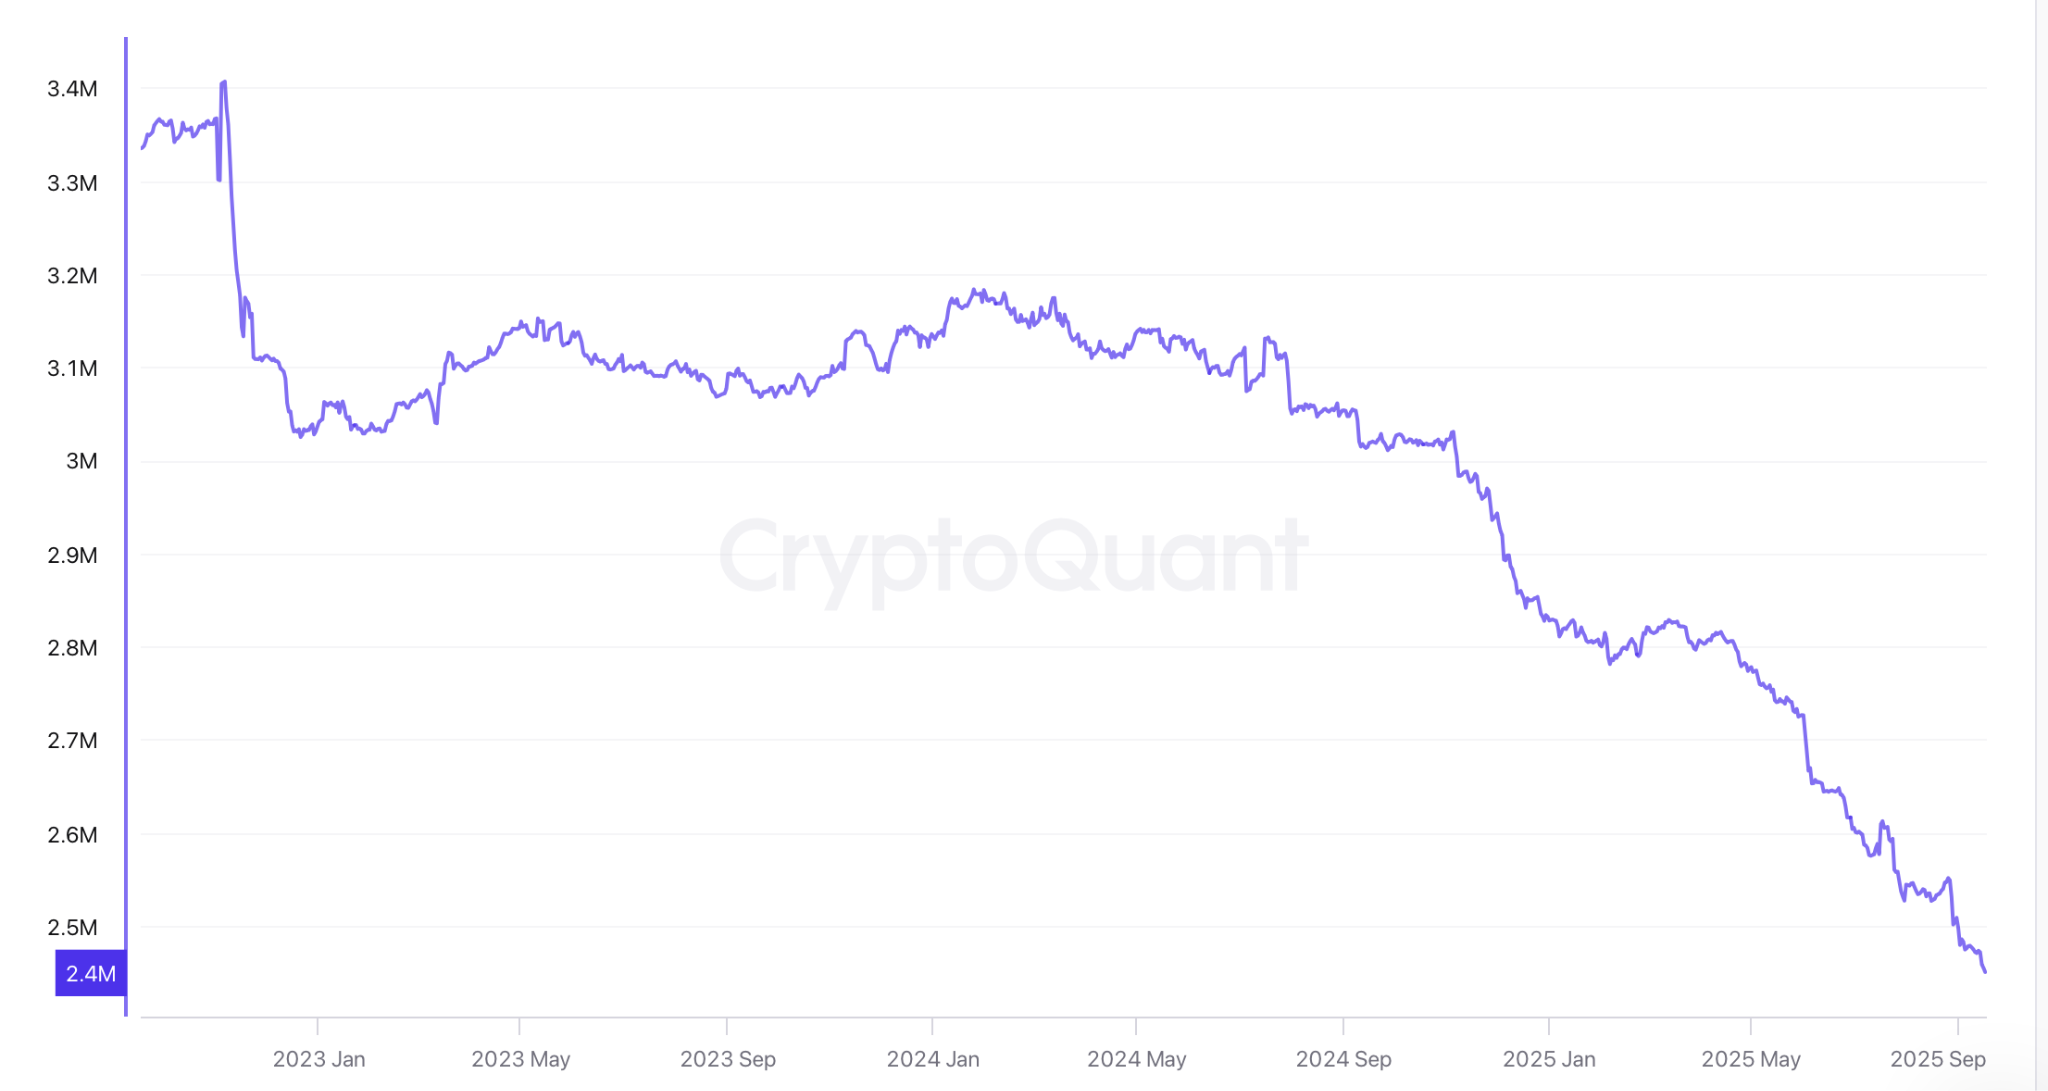
A year earlier, balances were above 3 million. Current levels mark a sharp drawdown and the lowest on record, suggesting that holders are increasingly transferring assets into private custody and easing near-term selling pressure.
ETF flows point to continued institutional demand. Between Sep. 8 and Sep. 17, U.S.-listed spot Bitcoin ETFs recorded more than $2.8 billion in net inflows, with every trading day in that period showing positive contributions.
Ethereum ETFs also attracted strong interest, with nearly $1 billion in inflows during the same stretch. On Sep. 15 alone, spot ETH funds pulled in $360 million, surpassing Bitcoin ETFs for the day.
The next stage will hinge on how the Fed matches its rate decision with guidance. A 25 basis point cut paired with signals of more easing could lift sentiment further, with Bitcoin moving closer to $120,000 and Ethereum testing levels above $4,600.
A more guarded message that poses inflation risks or a limited path for cuts could restrain the upside, keeping Bitcoin and Ethereum consolidating while smaller tokens face greater downside pressure.
September’s historic drag meets fresh tariff headwinds
Historical data shows that September has long been one of the weakest months for U.S. equities. Since 1950, the S&P 500 has averaged a return of about −0.68% in September, the lowest of any month in the calendar year.
The index has finished higher in only about 44% of Septembers during that span. The Nasdaq has recorded a slightly better frequency of positive outcomes but still shows a higher chance of losses than other months.
Crypto markets display a similar seasonal pattern. Bitcoin has historically struggled in September, with an average monthly decline of more than 3% since inception.
In many years the monthly low for Bitcoin has occurred within the first 10 days of September, followed by a recovery into the fourth quarter. Market participants often refer to this rebound phase as “Uptober.”
Amid this backdrop, tariff policy remains one of the biggest sources of uncertainty. In 2025 the U.S. has imposed steep levies, including a wide range of tariffs on different countries and products. These measures are feeding inflation by driving up production and input costs.
The Congressional Budget Office has revised its outlook for real GDP growth in 2025 to around 1.4%, down from earlier forecasts closer to 1.9–2.0%.
Rising tariffs and persistent inflation add to macro uncertainty, which often weighs on risk assets such as digital tokens. However, crypto can sometimes benefit in such conditions, as some investors view it as an alternative store of value when traditional markets appear fragile.
Taken together, a mix of inflation surprises, tariff escalation, weaker consumption, and economic challenges could trigger sharper volatility. Isolated shocks, by contrast, may cause short-term swings but are unlikely to disrupt the broader crypto market trend on their own.
Fed cut sparks split in market views
Anthony Pompliano, a well-known crypto investor and co-founder of Pomp Investments, believes the Fed’s rate cut will add fuel to an already strong market.
He points out that the S&P 500 has climbed more than 30% in five months, a move that has occurred only six times since 1975.
“In 100% of these cases, the S&P 500 has ended higher in the following six and 12 months,” he said, noting an average gain of 18% in the year ahead. He added that momentum is firmly intact and “this bull market is not even close to over.”
He also highlighted the unusual backdrop for the Fed’s expected cut. Household net worth rose by $7 trillion in the second quarter of 2025, yet wealth distribution remains heavily skewed, with the top 1% holding far more than the bottom 50%.
Despite these disparities, he emphasized that “asset owners are going to be winners and savers will be losers moving forward.”
In his view, the Fed is behind the curve and should cut by 50 to 75 basis points, but even a smaller move will add liquidity and lift asset prices, from stocks to gold to Bitcoin.
Other analysts, however, are more cautious in the short term. Ted, a crypto market analyst, warns that seasonal factors such as September’s triple witching expiration could add pressure.
“Since 2000, the S&P 500 has averaged a -1.17% return in the week after triple witching. If this happens again, Bitcoin could drop 5%-8%, while alts could drop 15%-20%,” he wrote.
For now, structural inflows and Fed easing may keep the broader trend intact, but the near-term window carries elevated volatility risk. A pullback in Bitcoin and sharper corrections in altcoins cannot be ruled out if negative catalysts align. As always, trade wisely and never invest more than you can afford to lose.
Disclosure: This article does not represent investment advice. The content and materials featured on this page are for educational purposes only.


You May Also Like

Vanguard Overtakes BlackRock as Top US ETF Manager — What’s Next for Investors?

Why Sky Protocol is Diversifying Beyond DeFi Yield Strategies

Has Customer Service Actually Improved at the Social Security Administration?


