

Dogecoin price clings to $0.10 as intraday oversold invites snapback

Risk-off flows sweep across crypto as the Dogecoin price hovers near $0.10, with Bitcoin dominance above 58% and total market cap down ~1.6%, funneling liquidity into BTC and stablecoins while intraday oversold conditions leave room for brief reflex bounces.
Meanwhile, this moment matters because daily structure is neutral-to-soft while lower timeframes are already washed out. Trend participants are selling strength; mean-reversion traders are stalking bounces. Which side wins will be decided around $0.10–$0.11.
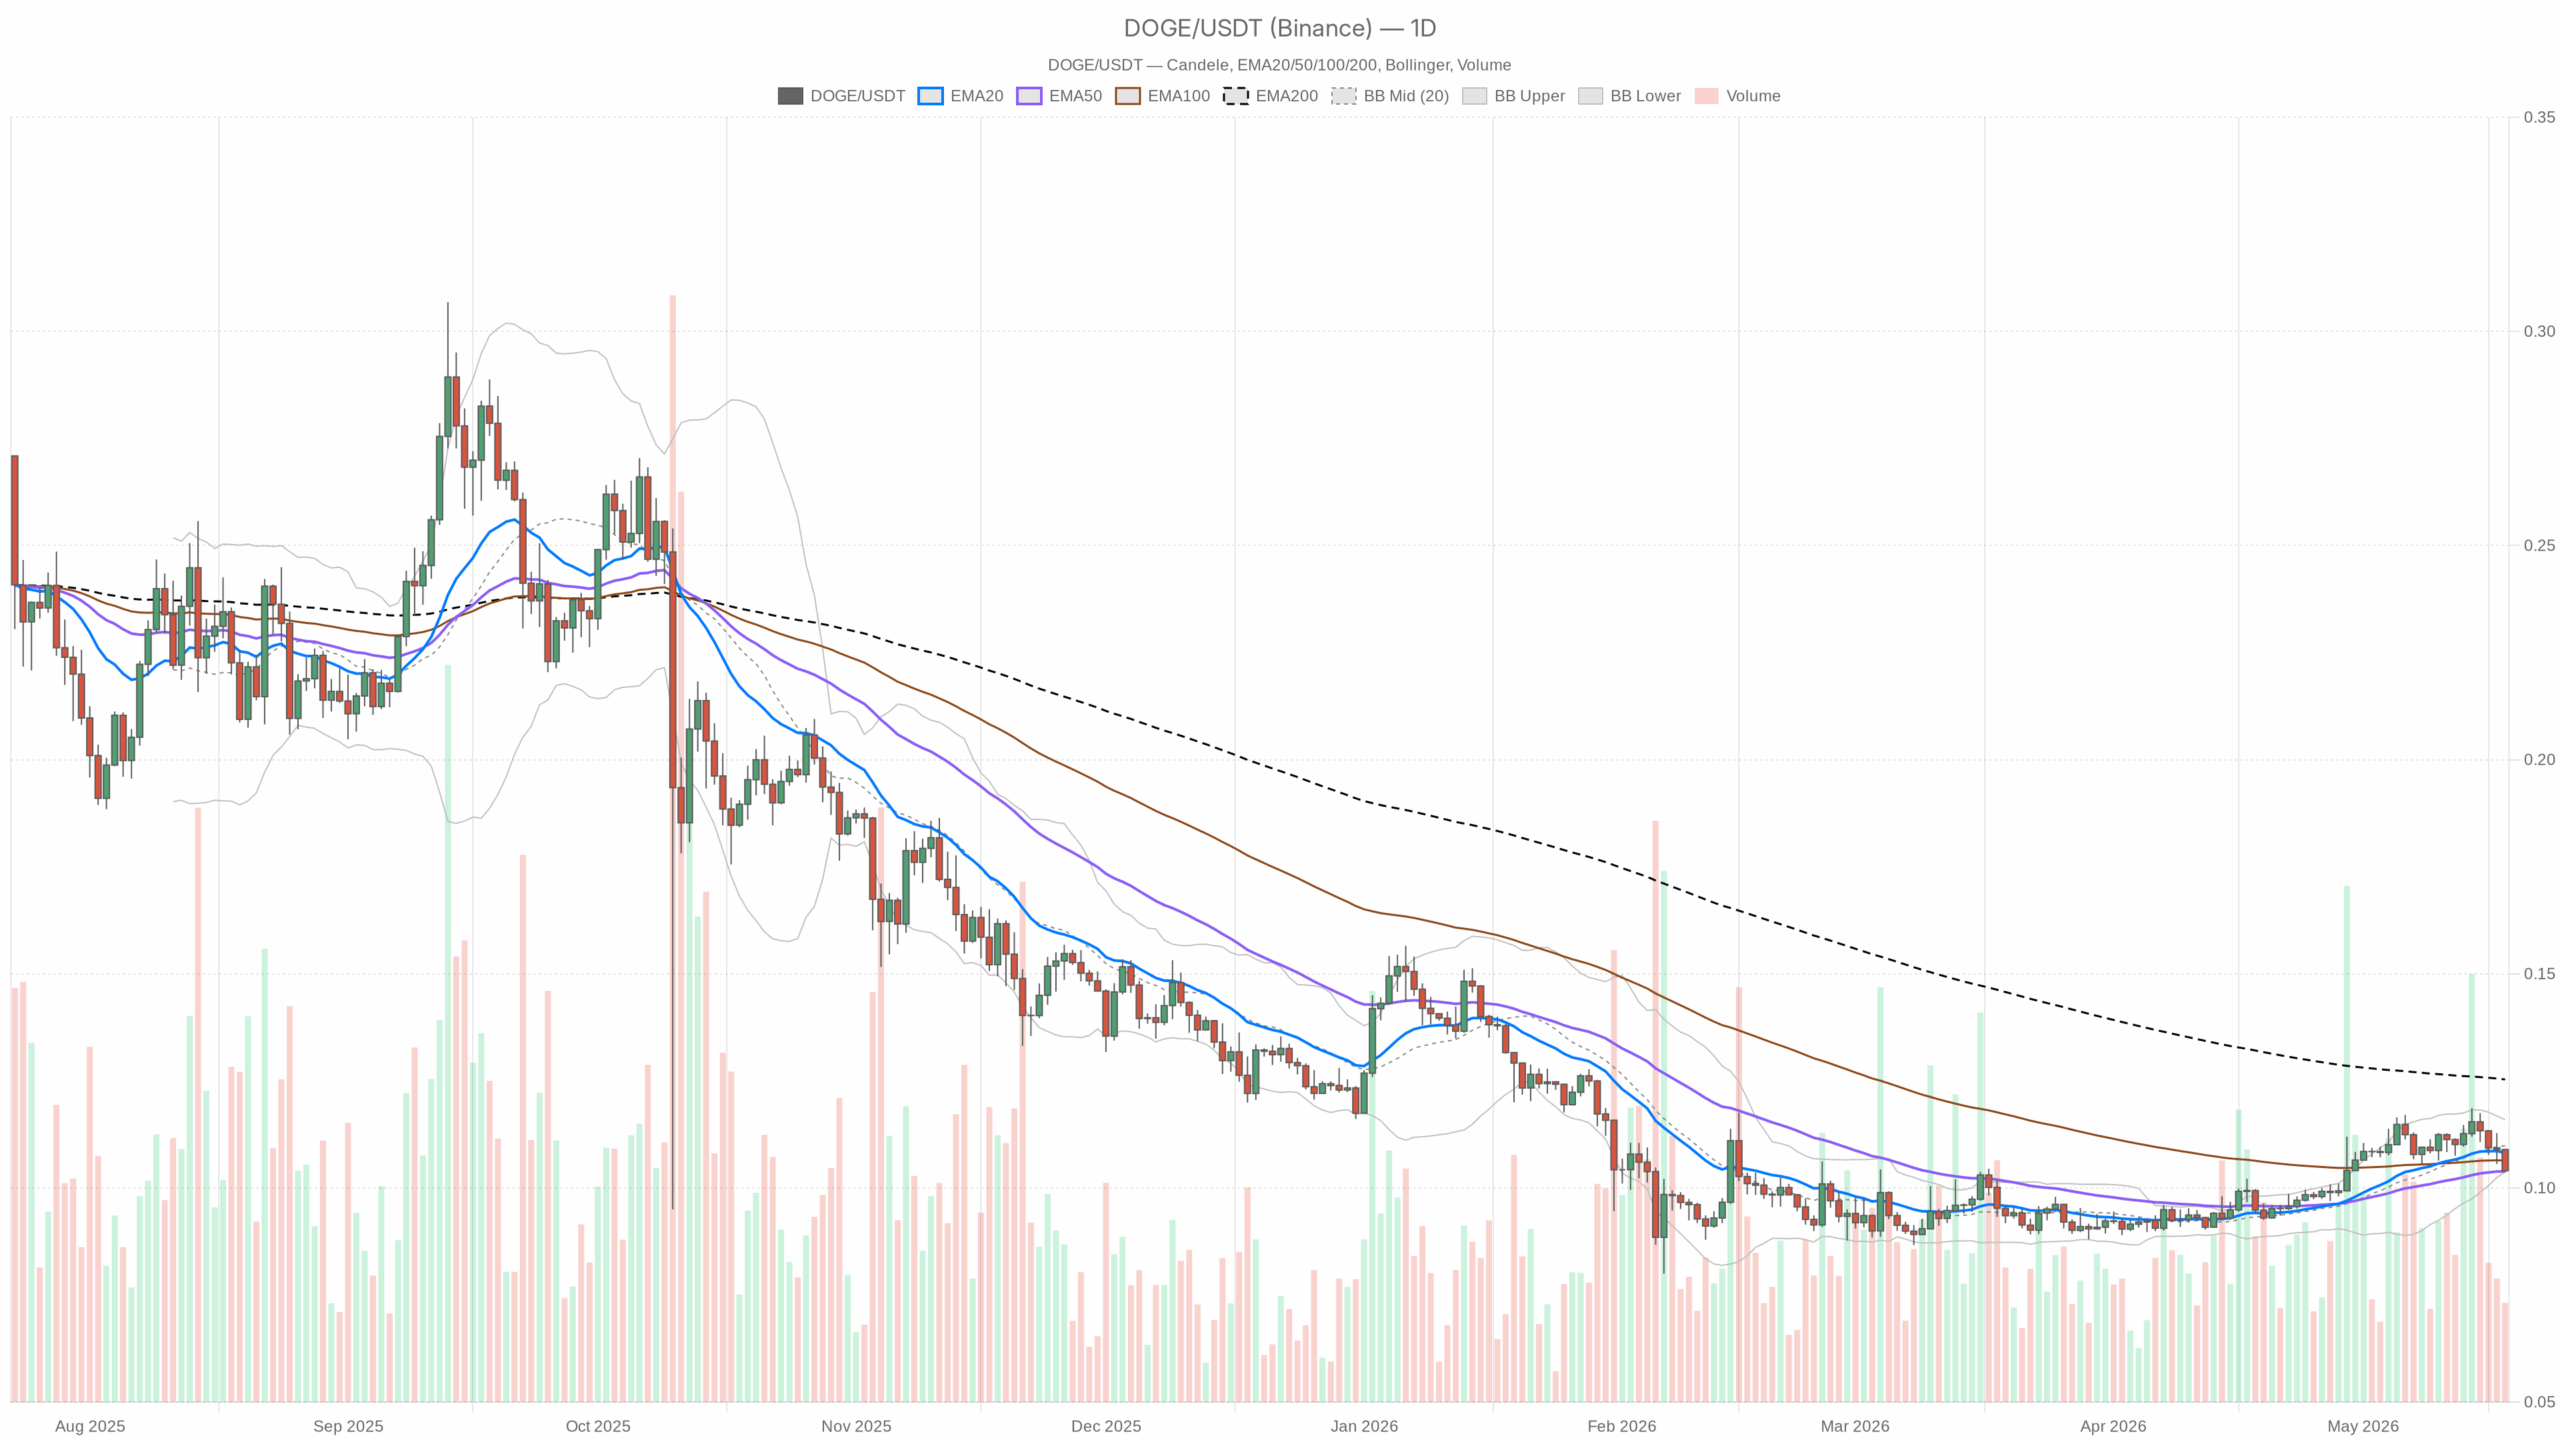 DOGE/USDT — daily chart with candlesticks, EMA20/EMA50 and volume.
Main scenario (Daily bias): Neutral, with a bearish tilt
On the daily chart, DOGE trades below fast and long MAs and rides the lower Bollinger Band. That keeps the burden of proof on buyers. A daily close back above ~$0.11 would shift the tone toward balance. Lose $0.10 decisively and continuation lower opens up.
Market context
As of 18 May 2026, Fear & Greed sits at 28 (Fear). Over the last 24 hours, total crypto market cap fell ~1.55% while volumes rose. That is a classic risk-off mix: dips attract activity, but it is mostly defensive. In that environment, the Dogecoin price typically underperforms until BTC stabilizes.
Daily (macro bias)
Trend and EMAs: Close $0.10; EMA20 $0.11; EMA50 $0.10; EMA200 $0.13. Currently, price is under the 20- and 200-day while hovering on the 50-day—bears have the initiative unless $0.11 is reclaimed.
RSI(14) 45.19. Sub-50 momentum shows lack of punch from buyers, but it is not washed out—there is room for either a fade or a bounce.
MACD: Flat around the zero line. Momentum is indecisive; range behavior dominates until a clear cross/expansion develops.
Bollinger Bands: Mid $0.11, Upper $0.12, Lower $0.10; price is tagging the lower band. However, first touches often produce reflex bounces toward the mid-band near $0.11 even as riding the band favors continuation lower.
ATR(14) ~$0.01. Daily swings around 10% are on the table. Consequently, position sizing needs respect. A single session can cover the entire $0.10–$0.11 range.
Pivots: PP ~$0.11, R1 ~$0.11, S1 ~$0.10. Trading below the pivot and sitting on S1 keeps pressure on the downside. However, back above the pivot relaxes it.
1H (confirms/weakens the daily)
Trend and EMAs: Price ~$0.10 sits beneath the 20/50/200-hour cluster near ~$0.11. Therefore, the intraday trend is down and any bounce faces stacked resistance into $0.11.
RSI(14) 21.57. It is heavily oversold—good fuel for a snapback, but without reclaiming the EMA stack it is usually a sell-the-bounce setup.
Bollinger Bands: Mid ~$0.11, Lower ~$0.10; price remains pinned to the lower band. Yet a mean-reversion pop toward the mid-band is plausible, and trend sellers likely fade it.
MACD: Muted. Thus, no clean impulse yet, keeping probabilities skewed to rangey-to-down until structure changes.
15m (execution context)
Trend and EMAs: Price trades under the short-term EMAs clustered around ~$0.11. Accordingly, the micro trend remains bearish; expect supply on approaches to prior breakdown levels.
RSI(14) 26.22. Short-term oversold—there is room for a scalp bounce, but the burden is on buyers to build higher lows.
MACD: Quiet. For now, momentum lacks follow-through; fades have worked until the EMA stack turns.
How the tape could evolve
Bullish path: Hold the $0.10 shelf and reclaim $0.11 on a daily close (aligning with the 20-day EMA and pivot). From there, a squeeze toward the upper band near $0.12 becomes viable. If broader risk appetite improves, a stretch target at the 200-day near $0.13 is possible. This view breaks down if price loses $0.10 on a daily close or if hourly bounces fail repeatedly below $0.11.
Bearish path: Break and daily close below $0.10, turning the lower band into resistance and expanding volatility. With ATR near $0.01, a follow-through move toward ~$0.09 is a reasonable extension in a weak tape. This path is invalidated by a swift reclaim and acceptance back above ~$0.11, especially if the hourly EMA stack flips to support.
Bottom line on positioning
Overall, the daily bias is neutral with a bearish lean, and intraday is oversold but still trending down. For swing exposure, patience around $0.10–$0.11 is key: bulls want acceptance back above $0.11; bears prefer to sell into $0.11–$0.12 with stops tight. Expect jumpy, headline-sensitive moves—ATR implies double-digit percentage swings are live. Keep size disciplined and respect invalidation levels; in a fear-driven, BTC-dominant market, chasing moves in DOGE carries elevated whipsaw risk.


Jums taip pat gali patikti

Grok AI Predicts Binance Coin Price if the SEC Approves a Spot BNB ETF in 2026

Why Businesses Need Professional Machine Design and Development Services


