

What are Fibonacci Retracements?
Fibonacci Sequence
The Meaning and Purpose of Fibonacci Retracements
How to Use Fibonacci Retracements
Popular Articles
View More
How to Get Free Solana? Proven Methods That Actually Work
Here is the honest answer most "free Solana" guides bury: there is no reliable way to earn a meaningful amount of free mainnet SOL if you are starting from nothing. Real methods do exist — airdrops,

Solana Price History: What the SOL Chart Shows and What It Leaves Out
Solana has two all-time highs, and they have almost nothing in common. The first, near $260 in November 2021, was driven by NFT and DeFi activity. The second, around $294 in January 2025, was driven

Will Solana Break $100 in July? Solana (SOL) Price Prediction July 2026 and Analyst Targets
Solana traders who checked their portfolios on July 1 saw a token that looked nothing like the one from three weeks earlier. SOL was changing hands around $85, according to CoinMarketCap, a sharp

Hot Crypto Updates
View More
Solana 24h DEX Volume Hits $4.15 Billion and Leads Onchain Trading
Overview Solana’s 24-hour decentralized exchange volume reached approximately $4.15 billion in a cross-chain market snapshot, placing it ahead of other major blockchain networks. According to a

The CLARITY Act Is Closer Than Ever — What It Means for XRP, SOL, and the Next Bull Cycle
The CLARITY Act entered the Senate calendar on June 1, 2026, after a bipartisan 15-9 committee vote. With Lummis pushing for a July 4 floor vote, here's what XRP, SOL, and global crypto traders need

Bitcoin ETFs Lost $1.26B — So Where Did the Money Go?
Bitcoin ETFs bled $1.26B in a single week while HYPE hit a new all-time high and XRP logged its strongest ETF inflow week of 2026. Here's what the rotation data actually tells us about where

Trending News
View More
XRP, Shiba Inu, Solana (SOL) and Ethereum (ETH) Price Analysis for June 10: Market Fuel Comes In Handy
New volatility fueling sources have appeared, but the momentum is certainly there. New volatility fueling sources have appeared, but the momentum is certainly
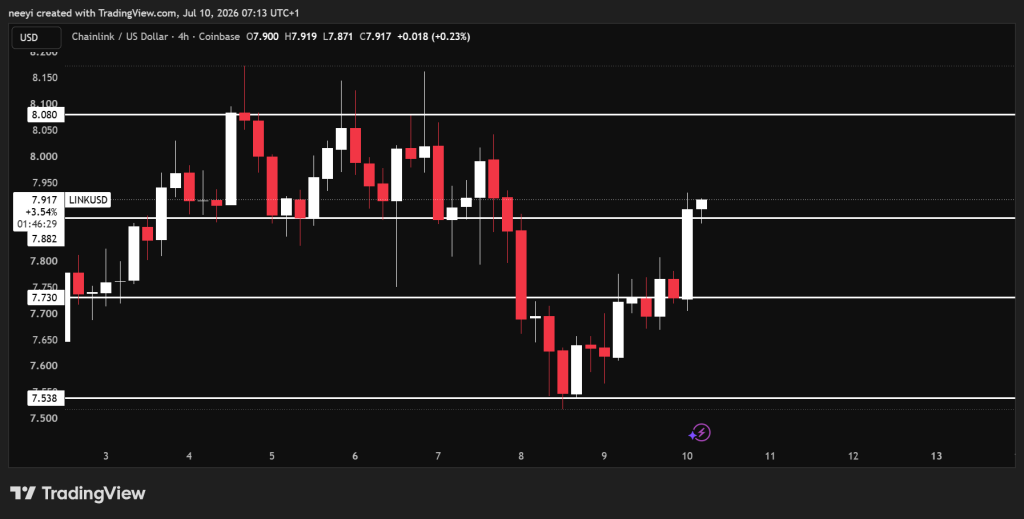
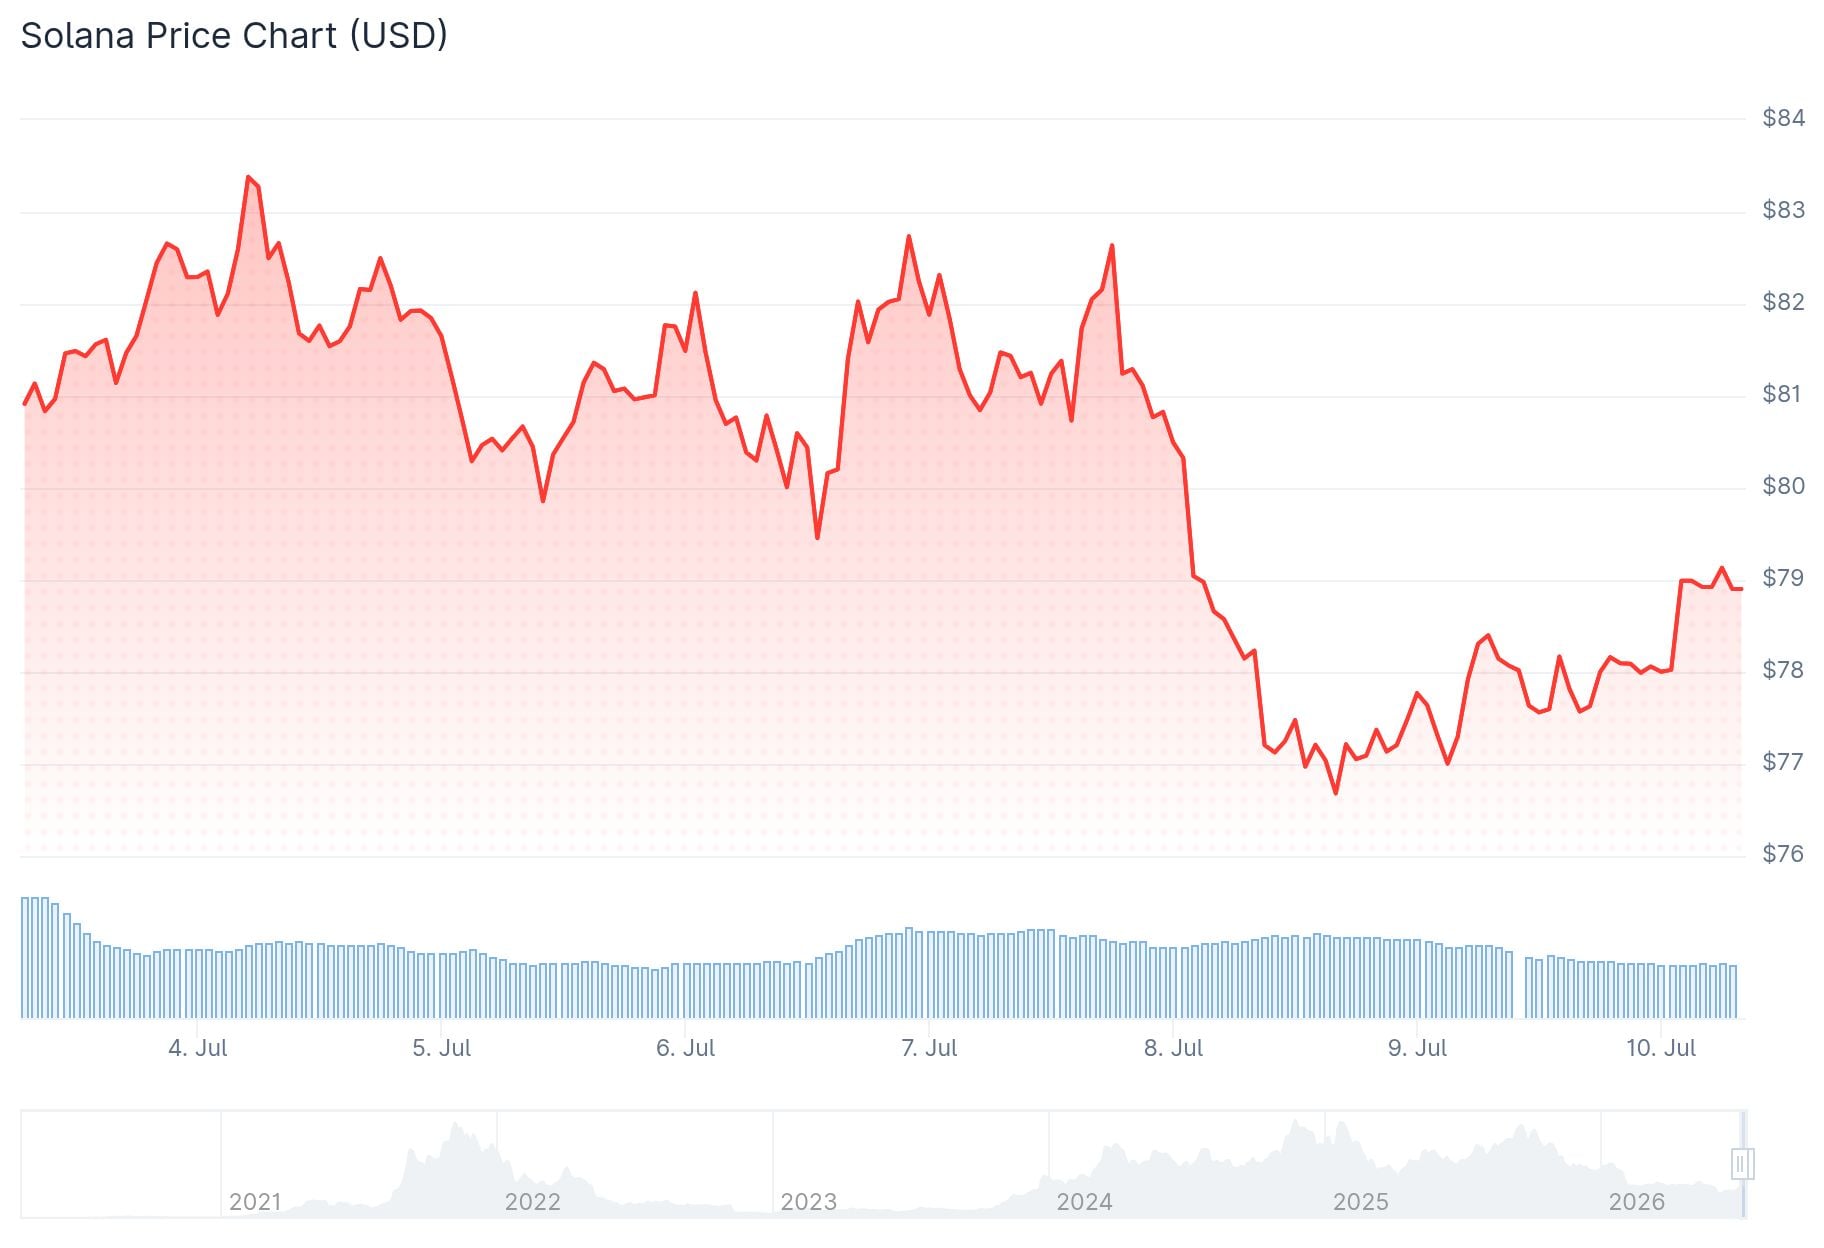
Crypto Price Prediction for Today, July 10: XRP, Solana (SOL), Chainlink (LINK)
Crypto prices opened today’s session with mixed signals, and that leaves plenty to watch over the next few hours. Chainlink, XRP, and Solana have each reached important

Related Articles
View More
How to Use TradingView on MEXC
TradingView is a powerful trading analysis tool that caters to users of all experience levels. MEXC has integrated TradingView's charting tools, allowing you to use them directly on the MEXC platform.

Analysis of Common Technical Indicators in the Cryptocurrency Market
In crypto trading, technical indicator analysis refers to a quantitative method that uses mathematical and statistical formulas to assess market trends. By processing price and volume data through spe

What Is the Stochastic Indicator (KDJ)?
The Stochastic Indicator (KDJ) is a technical analysis tool that analyzes price trends to assess market strength and identify overbought and oversold conditions, helping traders make buy and sell deci


