

How to View Positions and Funds in MEXC Futures Account

1. What Is Futures Trading Volume?
2. What Is FuturesOpen Interest?
3. What Is the Significance of Changes in Futures Trading Volume and Open Interest?
3.1 Significance of Futures Trading Volume
3.2 Identifying Breakouts vs. False Breakouts
3.3 Significance of Open Interest
3.4 Combining Trading Volume and Open Interest for Sentiment Analysis
4. Combined Analysis of Trading Volume and Open Interest
5. Practical Guide: How to Use Trading Volume and Open Interest to Inform Futures Trading
5.1 Confirming Trend Strength
5.2 Distinguishing Breakouts From False Breakouts
5.3 Analyzing Bullish and Bearish Sentiment
5.4 Risk Management and Strategy Adjustments
- Extremely High Open Interest: When open interest reaches very high levels, the market becomes prone to sharp volatility (e.g., liquidations or short/long squeezes). Lower leverage is advised to manage risk.
- Extremely Low Open Interest: When open interest is very low, the market trend may be weak, making short-term trades or staying on the sidelines more appropriate.
6. How to Track Changes in Open Interest
7. How to Check Your Positions
Recommended Reading
- Why Choose MEXC Futures? Gain an in-depth understanding of MEXC Futures trading advantages and features to help you seize opportunities in the Futures market.
- How to Trade Futures on MEXC App Learn the detailed trading process on the App, allowing you to get started easily and master Futures trading.
Popular Articles
View More
Will Coinbase Stock Hit $500? COIN Price Prediction for 2027 and 2030
Coinbase stock hit an intraday all-time high of $444.64 on July 18, 2025. By February 2026, the same stock was trading at $139, a decline of more than 68% in under seven months. As of June 25, 2026,

MEXC Card vs. MEXC Ether.Fi Card: Which Crypto Visa Card Is Right for You?
MEXC currently offers two distinct Visa cards for crypto users — the MEXC Card and the MEXC Ether.Fi Card — and while both let you spend cryptocurrency in everyday life, they are built on

MEXC Card Cashback: 4% to 10% Back in USDT — Here's How It Works
Getting cashback on everyday purchases is one of the most practical perks a crypto card can offer — but not all cashback programs are built the same. The MEXC Card takes a tiered approach, rewarding

Hot Crypto Updates
View More
Stablecoin Shortage in India: Why Traders Are Paying an 8.5% Premium for Crypto Dollars
India’s cryptocurrency market is facing an unusual situation: traders are paying significantly more than the global value of dollar-pegged digital assets, especially USDT (Tether), as a shortage of

MoneyGram Becomes a Solana Validator When Traditional Remittance Companies Start Building Blockchain Infrastructure
MoneyGram has officially become a validator on the Solana network, marking a new milestone in the blockchain strategy of one of the world's largest money transfer companies. The move comes just weeks

How Qualcomm and Micron Sparked a $400 Billion AI Stock Surge
The artificial intelligence (AI) investment boom received a powerful new boost on June 24, 2026, when semiconductor giants Qualcomm and Micron Technology delivered forecasts that reignited investor

Trending News
View More
Thermo Fisher Stock Trades at $513 While Wall Street Sets a $596 Target: What the EPS Ramp Reveals
Thermo Fisher beat EPS by nearly 4%, raised full-year guidance, and still trades 16% below Street consensus.

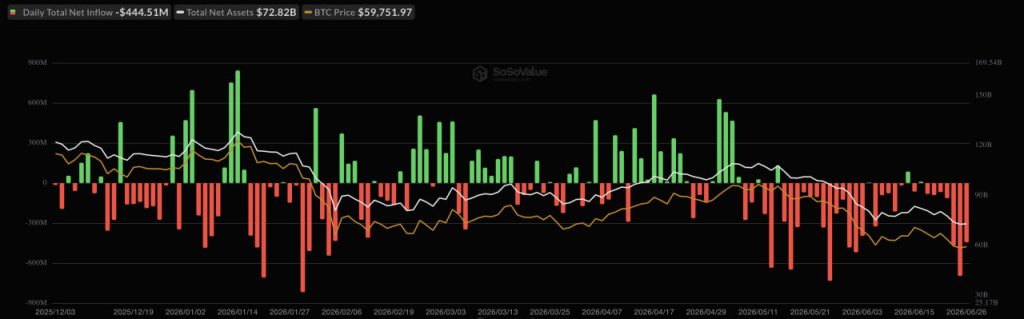
Bitcoin ETFs Suffer Record $4 Billion Monthly Outflow as Investor Sentiment
Spot Bitcoin exchange-traded funds (ETFs) have recorded their most severe month of investor withdrawals since their launch, marking a significant shift in i

Related Articles
View More
The Complete Guide to Coin-M Perpetual Futures on MEXC
In cryptocurrency derivatives, Futures trading enables investors to apply leverage to increase potential returns and to take positions in both rising and falling markets. MEXC offers two primary types
What is MEXC Futures Earn?
1. What is MEXC Futures Earn?Futures Earn is a financial product offered by MEXC for Futures users. Once activated, eligible funds in your Futures account will automatically enroll in this exclusive E

MEXC AI Strategy for Beginners: How AI Quant Trading Works
Key Takeaways:MEXC AI Strategy is officially live, allowing users to generate futures trading strategies using natural language, making it easy for beginners to get started. It integrates social media


