How to Read the Solana Price Chart: A Beginner's Guide to SOL/USD
- New to Solana? Start with our complete beginner's guide to Solana.
- The Solana price chart displays SOL's open, high, low, and close price data for every time period alongside trading volume.
- Candlestick color tells you direction at a glance — green means the price closed higher, red means it closed lower.
- The RSI, moving averages, and MACD are the three most beginner-relevant indicators for reading the Solana price chart.
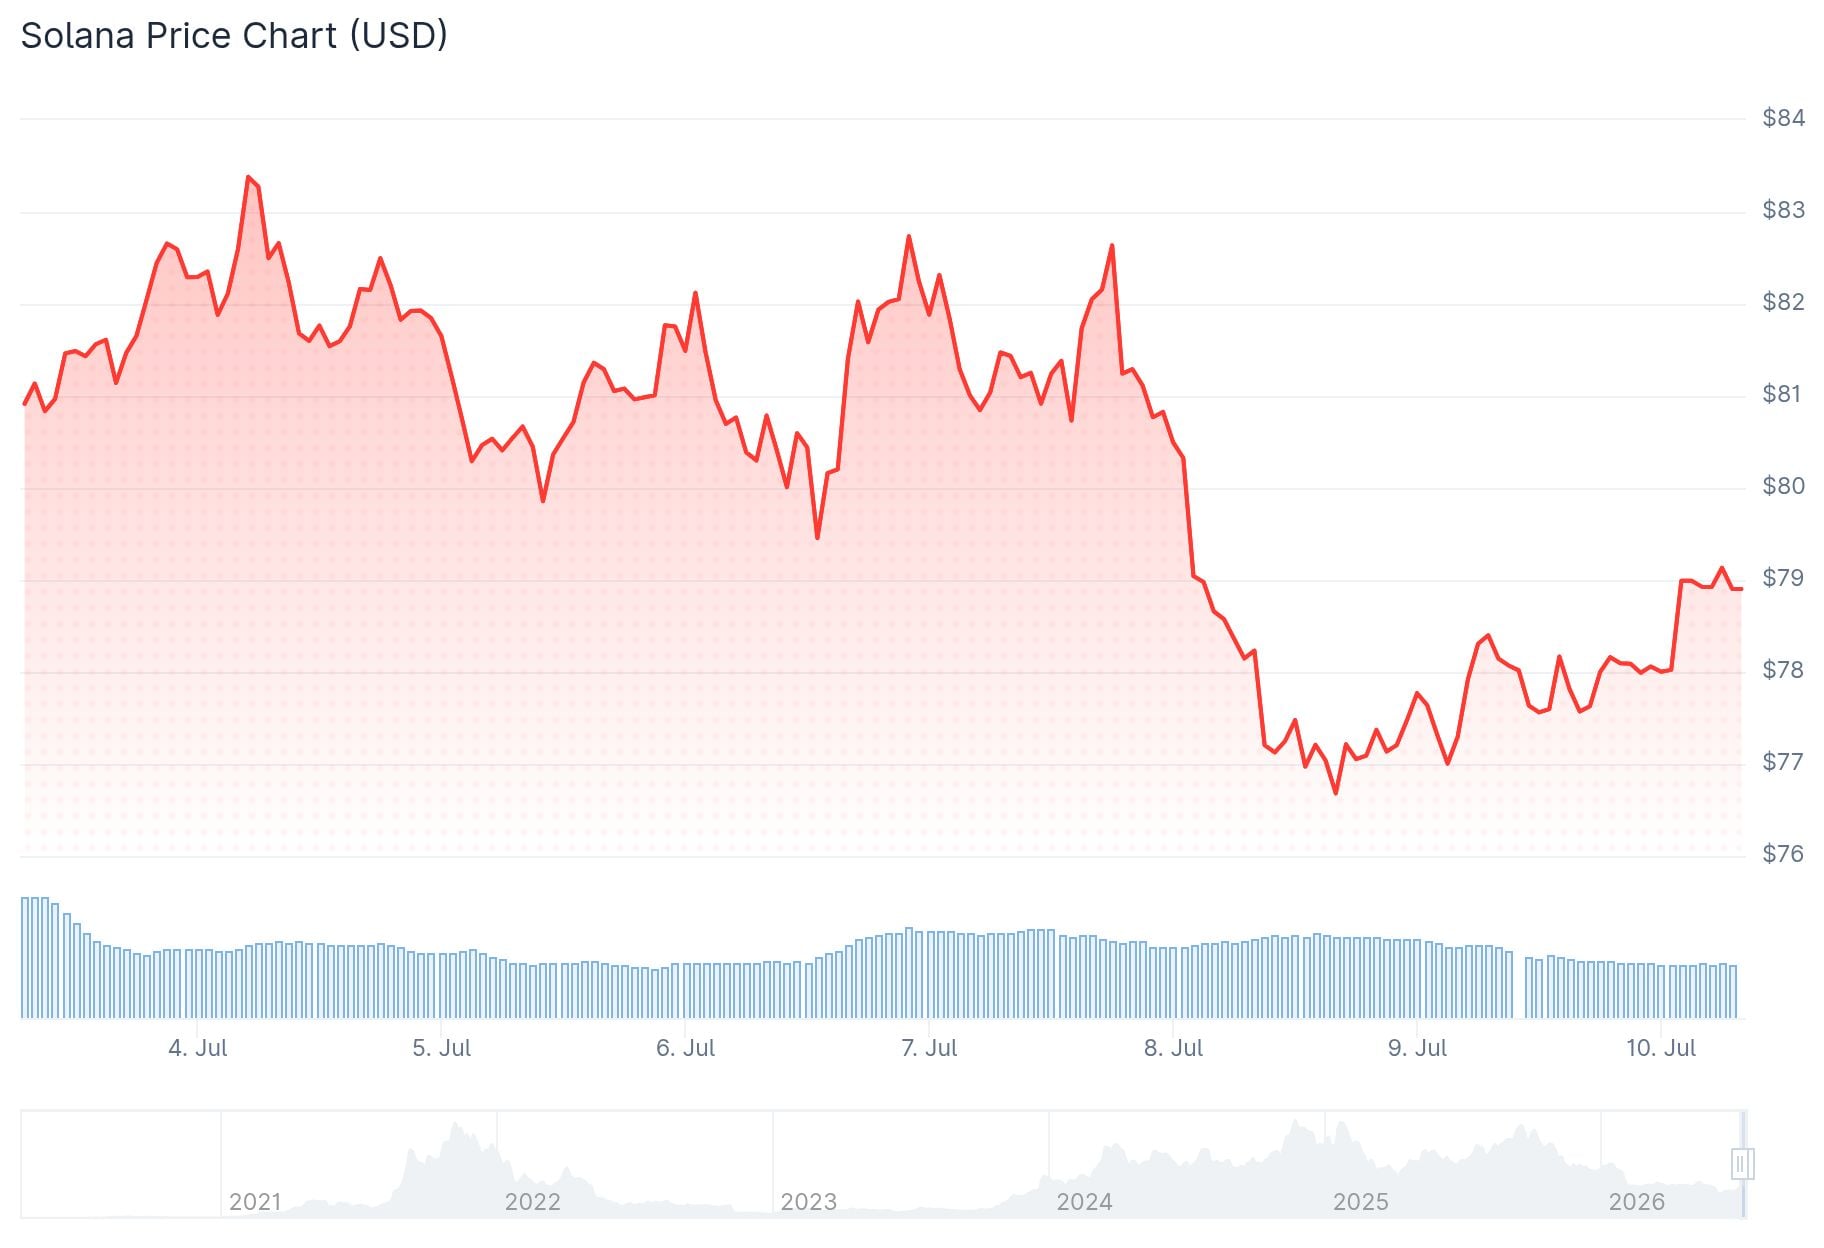
- SOL has traded from under $1 at public launch in March 2020 to an all-time high of approximately $295 in January 2025, according to CoinGecko.
- Support and resistance zones from SOL's price history remain relevant reference points for traders watching the chart today.
- CoinMarketCap, CoinGecko, and TradingView are the most reliable platforms for tracking the Solana live price chart for free.
What the Solana Price Chart Shows
Candlesticks and Timeframes on the Solana Chart
Volume and What It Confirms
Key Indicators for Solana Price Chart Technical Analysis
1. RSI — Reading Overbought and Oversold Conditions
- Go deeper with our guide on what drives Solana's value and how to read it.
2. Moving Averages — Spotting the Trend
3. MACD — Measuring Momentum Shifts
Solana Price Chart: Support, Resistance, and Price History
- Ready for forecasts? Read our SOL price prediction with analyst forecasts.
Where to Track the Solana Live Price Chart
Frequently Asked Questions
Conclusion
- Want the full picture? Read our complete guide to Solana (SOL) for fundamentals and ecosystem overview.
Popular Articles
View More
Solana Price History: What the SOL Chart Shows and What It Leaves Out
Solana has two all-time highs, and they have almost nothing in common. The first, near $260 in November 2021, was driven by NFT and DeFi activity. The second, around $294 in January 2025, was driven

Will Solana Break $100 in July? Solana (SOL) Price Prediction July 2026 and Analyst Targets
Solana traders who checked their portfolios on July 1 saw a token that looked nothing like the one from three weeks earlier. SOL was changing hands around $85, according to CoinMarketCap, a sharp

How High Can Solana (SOL) Go After the Iran Ceasefire Relief Rally?
Solana's price jumped within a day of a ceasefire announcement between the United States and Iran, and that one sentence says a lot about how crypto trades right now. Geopolitics, not just blockchain

Hot Crypto Updates
View More
Solana 24h DEX Volume Hits $4.15 Billion and Leads Onchain Trading
Overview Solana’s 24-hour decentralized exchange volume reached approximately $4.15 billion in a cross-chain market snapshot, placing it ahead of other major blockchain networks. According to a

The CLARITY Act Is Closer Than Ever — What It Means for XRP, SOL, and the Next Bull Cycle
The CLARITY Act entered the Senate calendar on June 1, 2026, after a bipartisan 15-9 committee vote. With Lummis pushing for a July 4 floor vote, here's what XRP, SOL, and global crypto traders need

Bitcoin ETFs Lost $1.26B — So Where Did the Money Go?
Bitcoin ETFs bled $1.26B in a single week while HYPE hit a new all-time high and XRP logged its strongest ETF inflow week of 2026. Here's what the rotation data actually tells us about where

Trending News
View More
XRP, Shiba Inu, Solana (SOL) and Ethereum (ETH) Price Analysis for June 10: Market Fuel Comes In Handy
New volatility fueling sources have appeared, but the momentum is certainly there. New volatility fueling sources have appeared, but the momentum is certainly
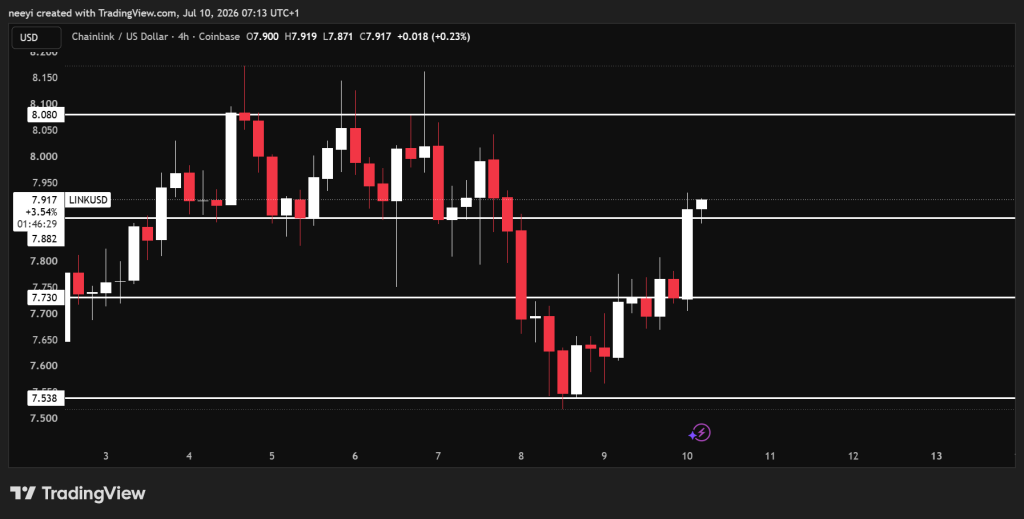
Crypto Price Prediction for Today, July 10: XRP, Solana (SOL), Chainlink (LINK)
Crypto prices opened today’s session with mixed signals, and that leaves plenty to watch over the next few hours. Chainlink, XRP, and Solana have each reached important

Related Articles
View MoreSolana Price History: What the SOL Chart Shows and What It Leaves Out
Solana has two all-time highs, and they have almost nothing in common.The first, near $260 in November 2021, was driven by NFT and DeFi activity. The second, around $294 in January 2025, was driven by

What Does BTC Mean in Text? We Read All 56 Slang Entries. "Because They Can" Isn't One.
Search "what does BTC mean in text" and the same answer comes back from site after site: "Because They Can."There is no record of anyone ever saying that.Two of them are the ones you'll actually hit i

Is Polkadot Dead? Polkadot Fixed Its Two Biggest Problems and DOT Fell Anyway
Polkadot is not dead.Its governance still passes major reforms and delivers them on the date it promised, including a supply cap that ended five years of uncapped issuance.But the ecosystem built on t