

What Makes Bitcoin’s Price Go Up or Down? A Complete Explainer

Last Updated: July 7, 2026
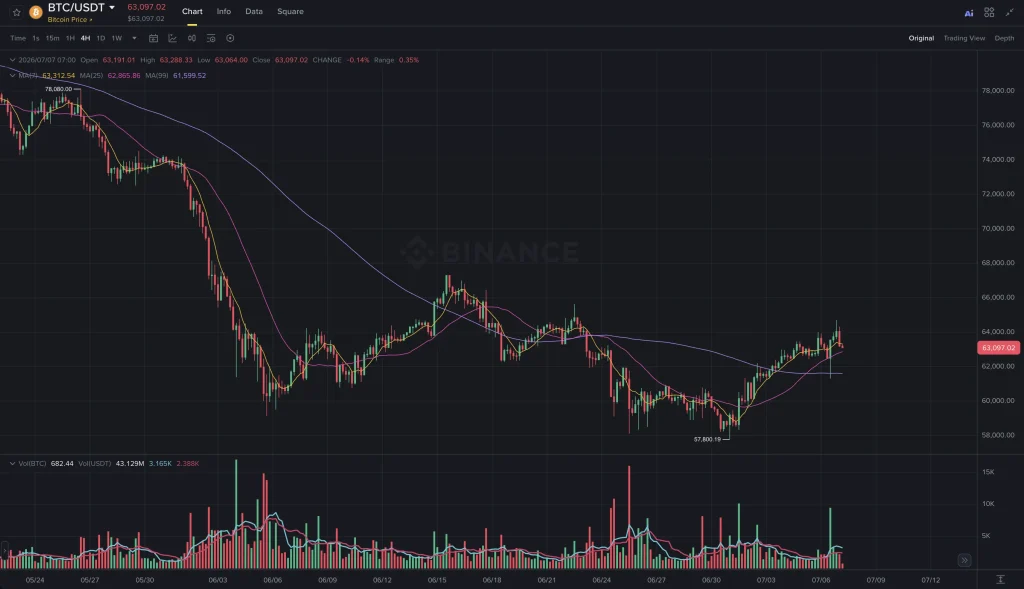
Bitcoin is trading near $63,044, up 6.17% over the past week as it recovers from a low near $57,800 hit in late June. The swing illustrates something worth understanding on its own terms: Bitcoin’s price doesn’t move on mystery or vibes. A small, repeatable set of forces drives nearly every major move, in both directions, and once you know what they are, headlines like “why is Bitcoin dropping” or “why is Bitcoin going up” stop being confusing and start being predictable.
Key Takeaways
- Bitcoin trades at $63,044, up 6.17% over the past 7 days, recovering from a June low near $57,800
- Five recurring forces drive most Bitcoin price moves: spot ETF flows, leverage and liquidations, Federal Reserve policy, regulatory developments, and large-holder (“whale”) activity
- ETF flows are the most closely watched real-time signal — sustained outflows preceded June’s drop, and their reversal helped drive the current recovery
- Leveraged positions amplify moves in both directions: heavy long positioning accelerates crashes, while heavy short positioning fuels squeezes like the one that helped lift BTC off its June low
- Bitcoin’s price action is nearly always a combination of these factors, not a single cause — resist any headline that reduces a move to one clean explanation
The Five Forces That Move Bitcoin’s Price
1. Spot ETF Flows
Since the 2024 launch of US spot Bitcoin ETFs, net daily inflows and outflows have become the single most-watched real-time demand signal. When ETFs like BlackRock’s IBIT see sustained inflows, it reflects real institutional buying pressure — money moving from cash into BTC exposure. Sustained outflows work in reverse, and because ETF flow data is published daily, it’s often the first hard number analysts point to when explaining a move. For a full breakdown of how these products work, see What Is a Bitcoin ETF.
How this played out recently: Bitcoin’s slide toward $57,800 in June coincided with a stretch of net ETF outflows. The subsequent recovery toward $63,000 has come alongside a return of net inflows — the clearest single data point behind the swing.
2. Leverage and Liquidations
A large share of crypto trading happens with borrowed money (leverage). When price moves against a heavily leveraged position, exchanges automatically close it — a liquidation — and that forced selling (or buying, for short positions) can accelerate the move that triggered it in the first place.
This is why crashes often look sharper than the news driving them would suggest: a modest selloff can trigger cascading long liquidations that turn a 3% move into a 10% one within hours. The same mechanic works in reverse — a market heavily positioned short can “squeeze” violently higher when price starts to recover, as short sellers are forced to buy back BTC to close their positions. Coinglass tracks liquidation data in real time and is the standard reference for how much leverage was wiped out during any given move.
3. Federal Reserve Policy and Macro Conditions
Bitcoin increasingly trades as a macro risk asset, correlated with the same forces that move tech stocks and other high-beta investments. Fed rate decisions, inflation data, and employment reports all shape expectations for monetary policy — and looser expected policy (rate cuts, dovish commentary) tends to support Bitcoin, while hawkish signals tend to pressure it.
Weak labor market data, for instance, typically increases the odds of future rate cuts, which weakens the dollar and lowers bond yields — a combination that historically benefits non-yielding assets like Bitcoin.
4. Regulatory Developments
Legislative and regulatory news moves Bitcoin less directly than ETF flows or leverage, but it shapes the multi-week trend by affecting institutional willingness to hold and trade the asset. Pending US legislation such as the CLARITY Act — which would formally classify certain digital assets and clarify SEC/CFTC jurisdiction — is a current example: shifts in its odds of passage have visibly moved prices on days with otherwise little other news. For the latest developments, see Crypto News Today.
5. Large-Holder (“Whale”) Activity
Wallets holding large BTC balances can move markets when they act in concentrated size. Sustained accumulation by large holders — visible on-chain as declining exchange balances — is typically read as a bullish signal, since it removes supply from the pool available to sell. The reverse, large deposits onto exchanges, often precedes selling pressure. On-chain analytics platforms like Glassnode and CryptoQuant track this activity in detail.
Why Bitcoin Fell in June — and Why It’s Recovering Now
June’s decline to $57,800 combined several of these forces at once: sustained ETF outflows reduced institutional demand at the same time as a hawkish Fed stance pressured risk assets broadly, and heavy long positioning meant that as price broke below key support levels, liquidations accelerated the move.
The recovery toward $63,000 reflects the same mechanics working in reverse — ETF flows have turned positive again, and short covering has added upward pressure as the market’s positioning shifted following weaker-than-expected US labor data, which raised the odds of Fed rate cuts. For live price data and levels, see Bitcoin Price Today.
What This Means Going Forward
None of these five forces work in isolation, and headlines that attribute a move to a single cause are almost always oversimplifying. The more useful approach is to track the forces themselves: ETF flow data (updated daily by providers like SoSoValue), leverage and liquidation levels (Coinglass), Fed policy signals, and on-chain exchange balance trends. Together, they explain the overwhelming majority of Bitcoin’s price action — whether the headline of the week is “why is Bitcoin crashing” or “why is Bitcoin going up.” For how these forces are playing out across the market right now, see Crypto Market Today.
This article is for informational purposes only and does not constitute financial advice.


You May Also Like

Netherlands CPI Holds Steady at 2.9% in June, Matching Forecasts

FLOKI Price Prediction 2030: Can $FLOKI Reclaim Its Old Highs?

BNB Price Prediction: New Red Packet Code Launch Is Here



