

Bitcoin Price Reclaims $70,000 As Trump Declares Possible End To Iran War
Bitcoin price is trading around $70,700, up 3% over the past 24 hours, as President Donald Trump suggests a possible end to the Israeli and U.S. military campaign against Iran.
The administration’s de-escalation rhetoric triggered an immediate reversal in global energy markets, sending West Texas Intermediate (WTI) crude plunging from overnight highs of $120 back to $85 per barrel.
However, things might differ from Trump’s claims. The Iranian government has stated there are no ceasefire talks. Consequently, both crypto and stock markets appear to be slowing down, awaiting ceasefire confirmation or Iran’s assertion that the war is not yet over.
EXPLORE: Best New Cryptocurrencies in 2026 – Recently Launched Coins & Investment Watchlist
Bitcoin Price Surges And Oil Dumps on Claims Of Possible End to War
Trump’s late-afternoon comments suggested that military operations in the region are operating “very far ahead” of the administration’s initial four-to-five-week projected time frame, fundamentally altering the macroeconomic outlook for the quarter. Prior to the announcement, the Iran conflict had driven a historic oil price frenzy, raising immediate concerns about widespread energy price shocks and a subsequent resurgence in sticky global inflation.
As WTI crude collapsed by over 30% from its Sunday evening peak, ultimately settling 6% lower for the day, the implied threat of sustained inflationary pressure rapidly unwound. This normalization in energy markets directly translates into easing Treasury yields, as traders aggressively reprice the Federal Reserve’s likely interest rate trajectory for the remainder of the year.
The resulting drop in the opportunity cost of holding non-yielding digital assets effectively spurred capital to flow back into riskier investments. However, geopolitical experts caution that the ambitious operational scope, including dismantling Iran’s missile infrastructure and tackling regional proxy forces, makes military manoeuvres likely to remain complex even with the administration’s optimistic victory messaging.
And after the initial dump, oil prices are now back to $89 a barrel.
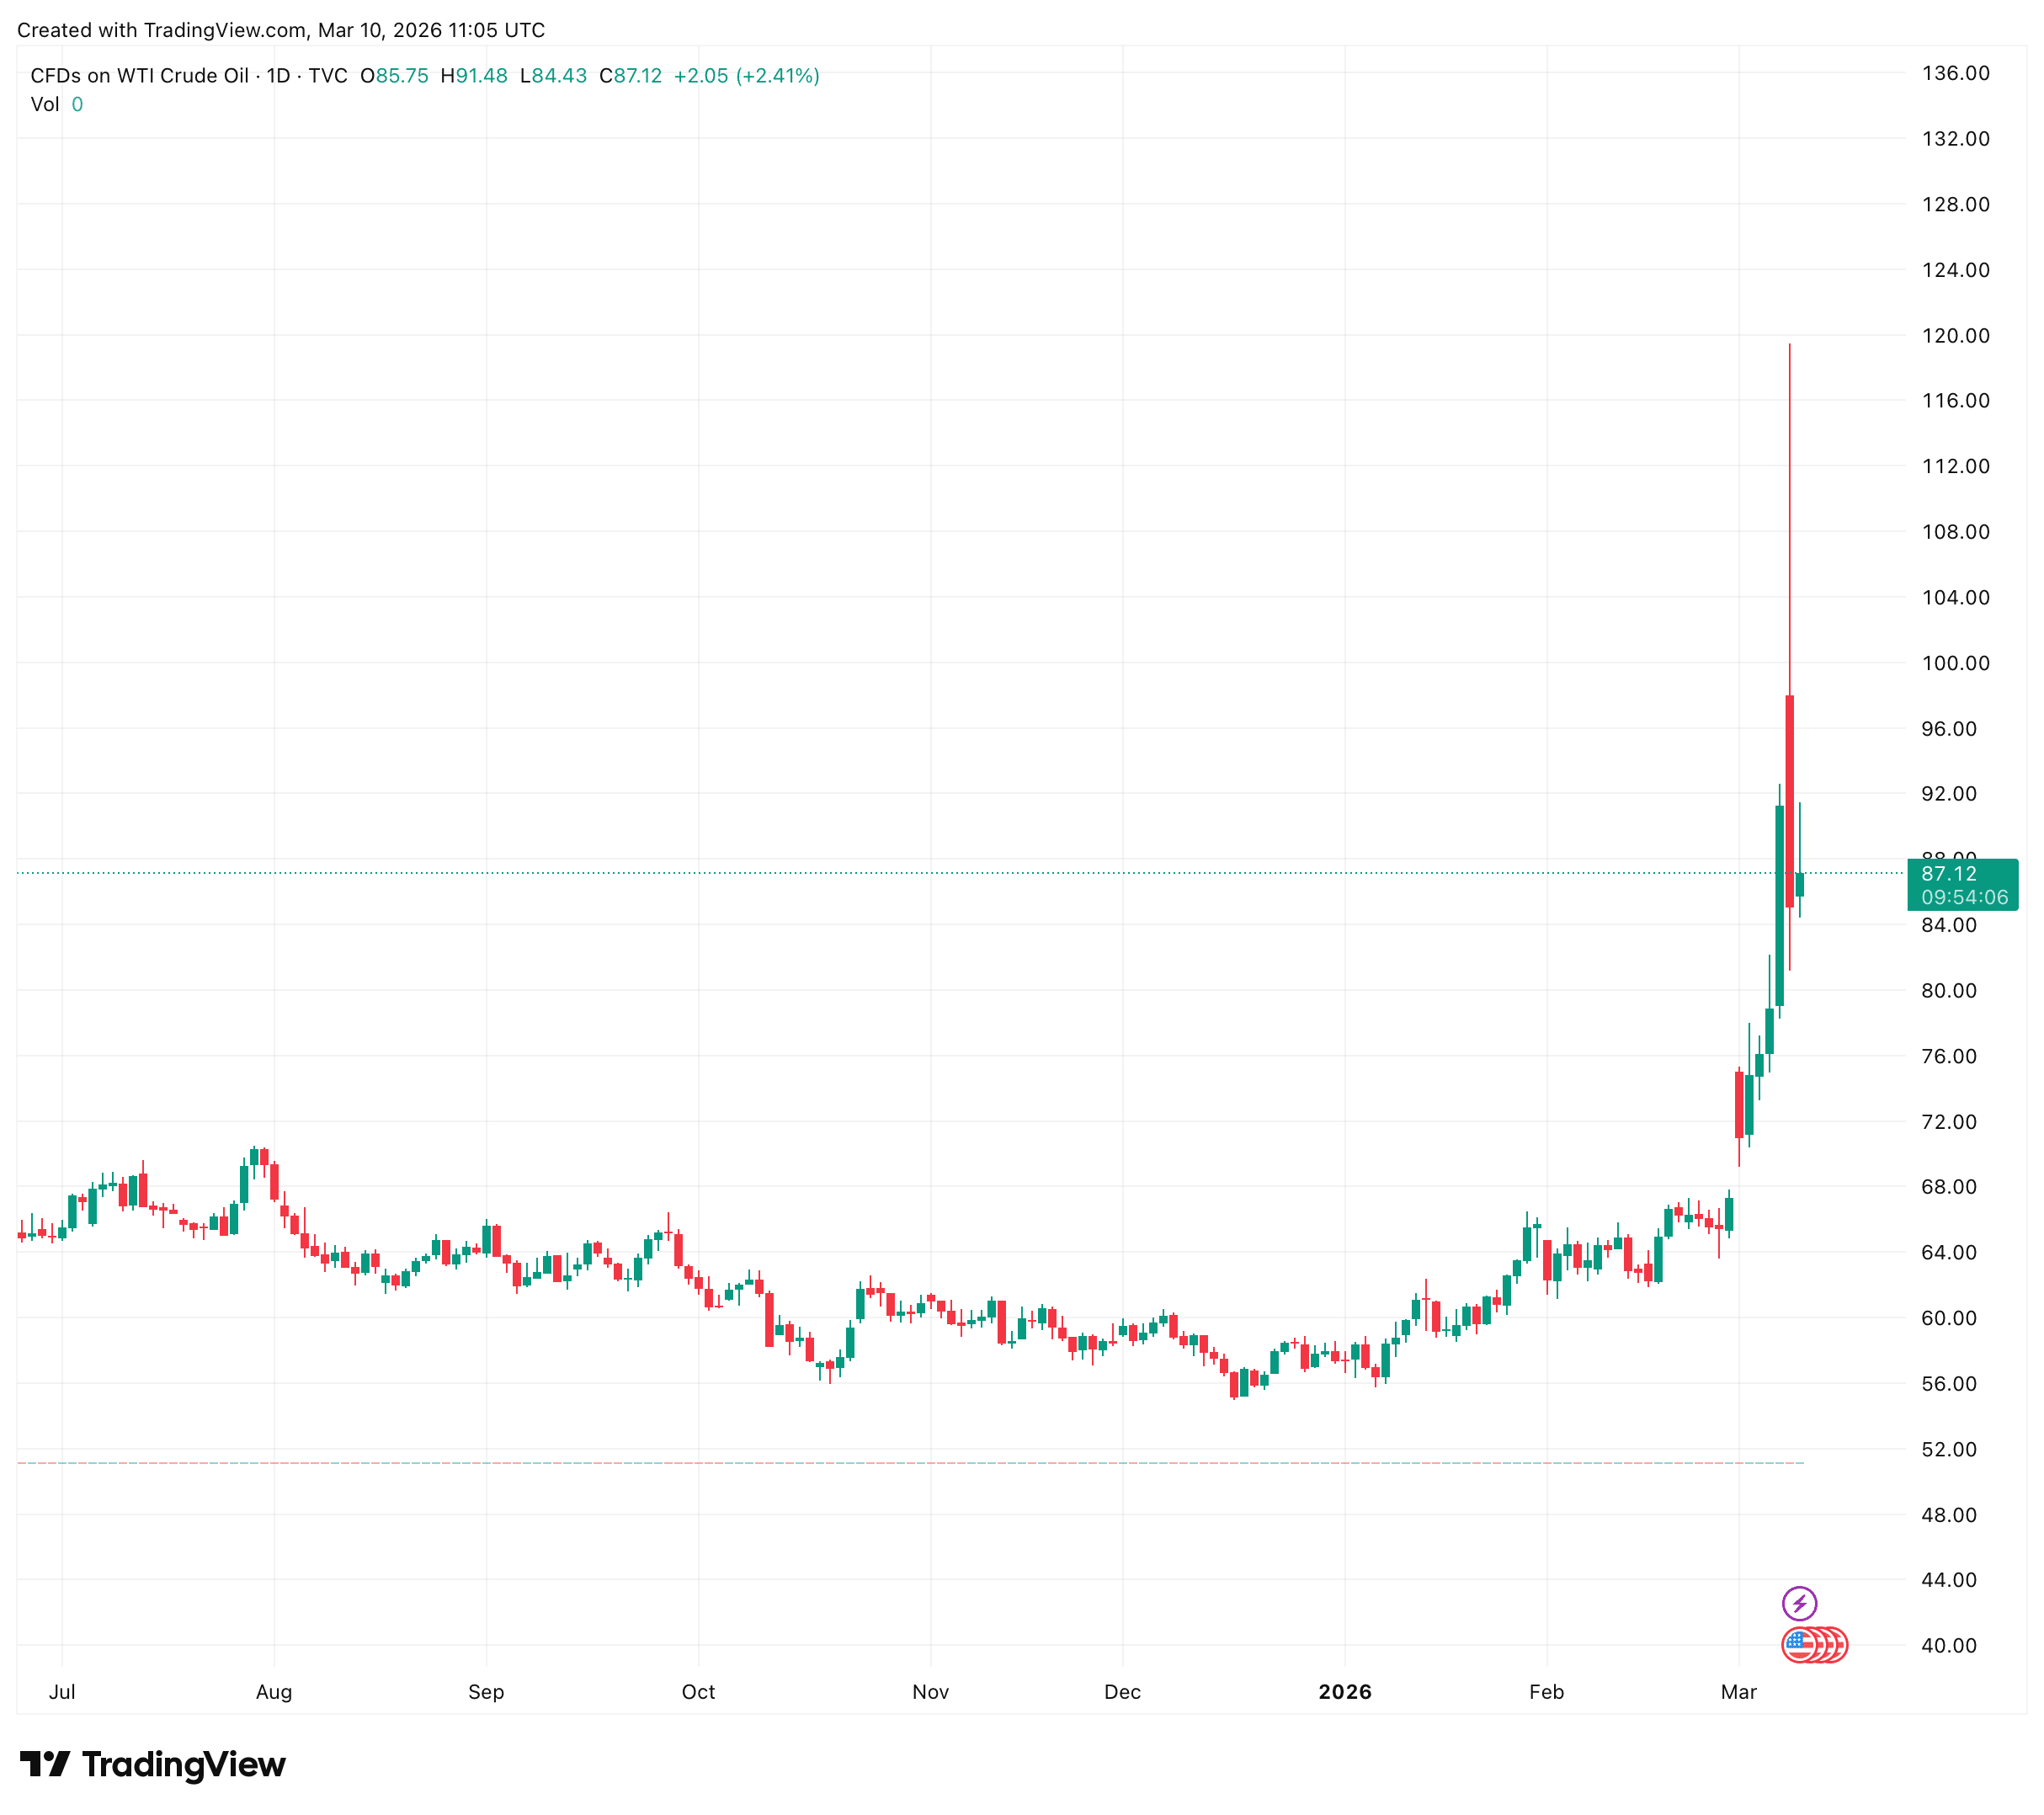
WTI Crude Oil Source: TradingView
EXPLORE: Bitcoin Drops to 7-Day Low Amid Oil Surge and Macro Risk-Off
Bitcoin Price Recovery Above $70,000 Preserves Bullish Structure: For Now
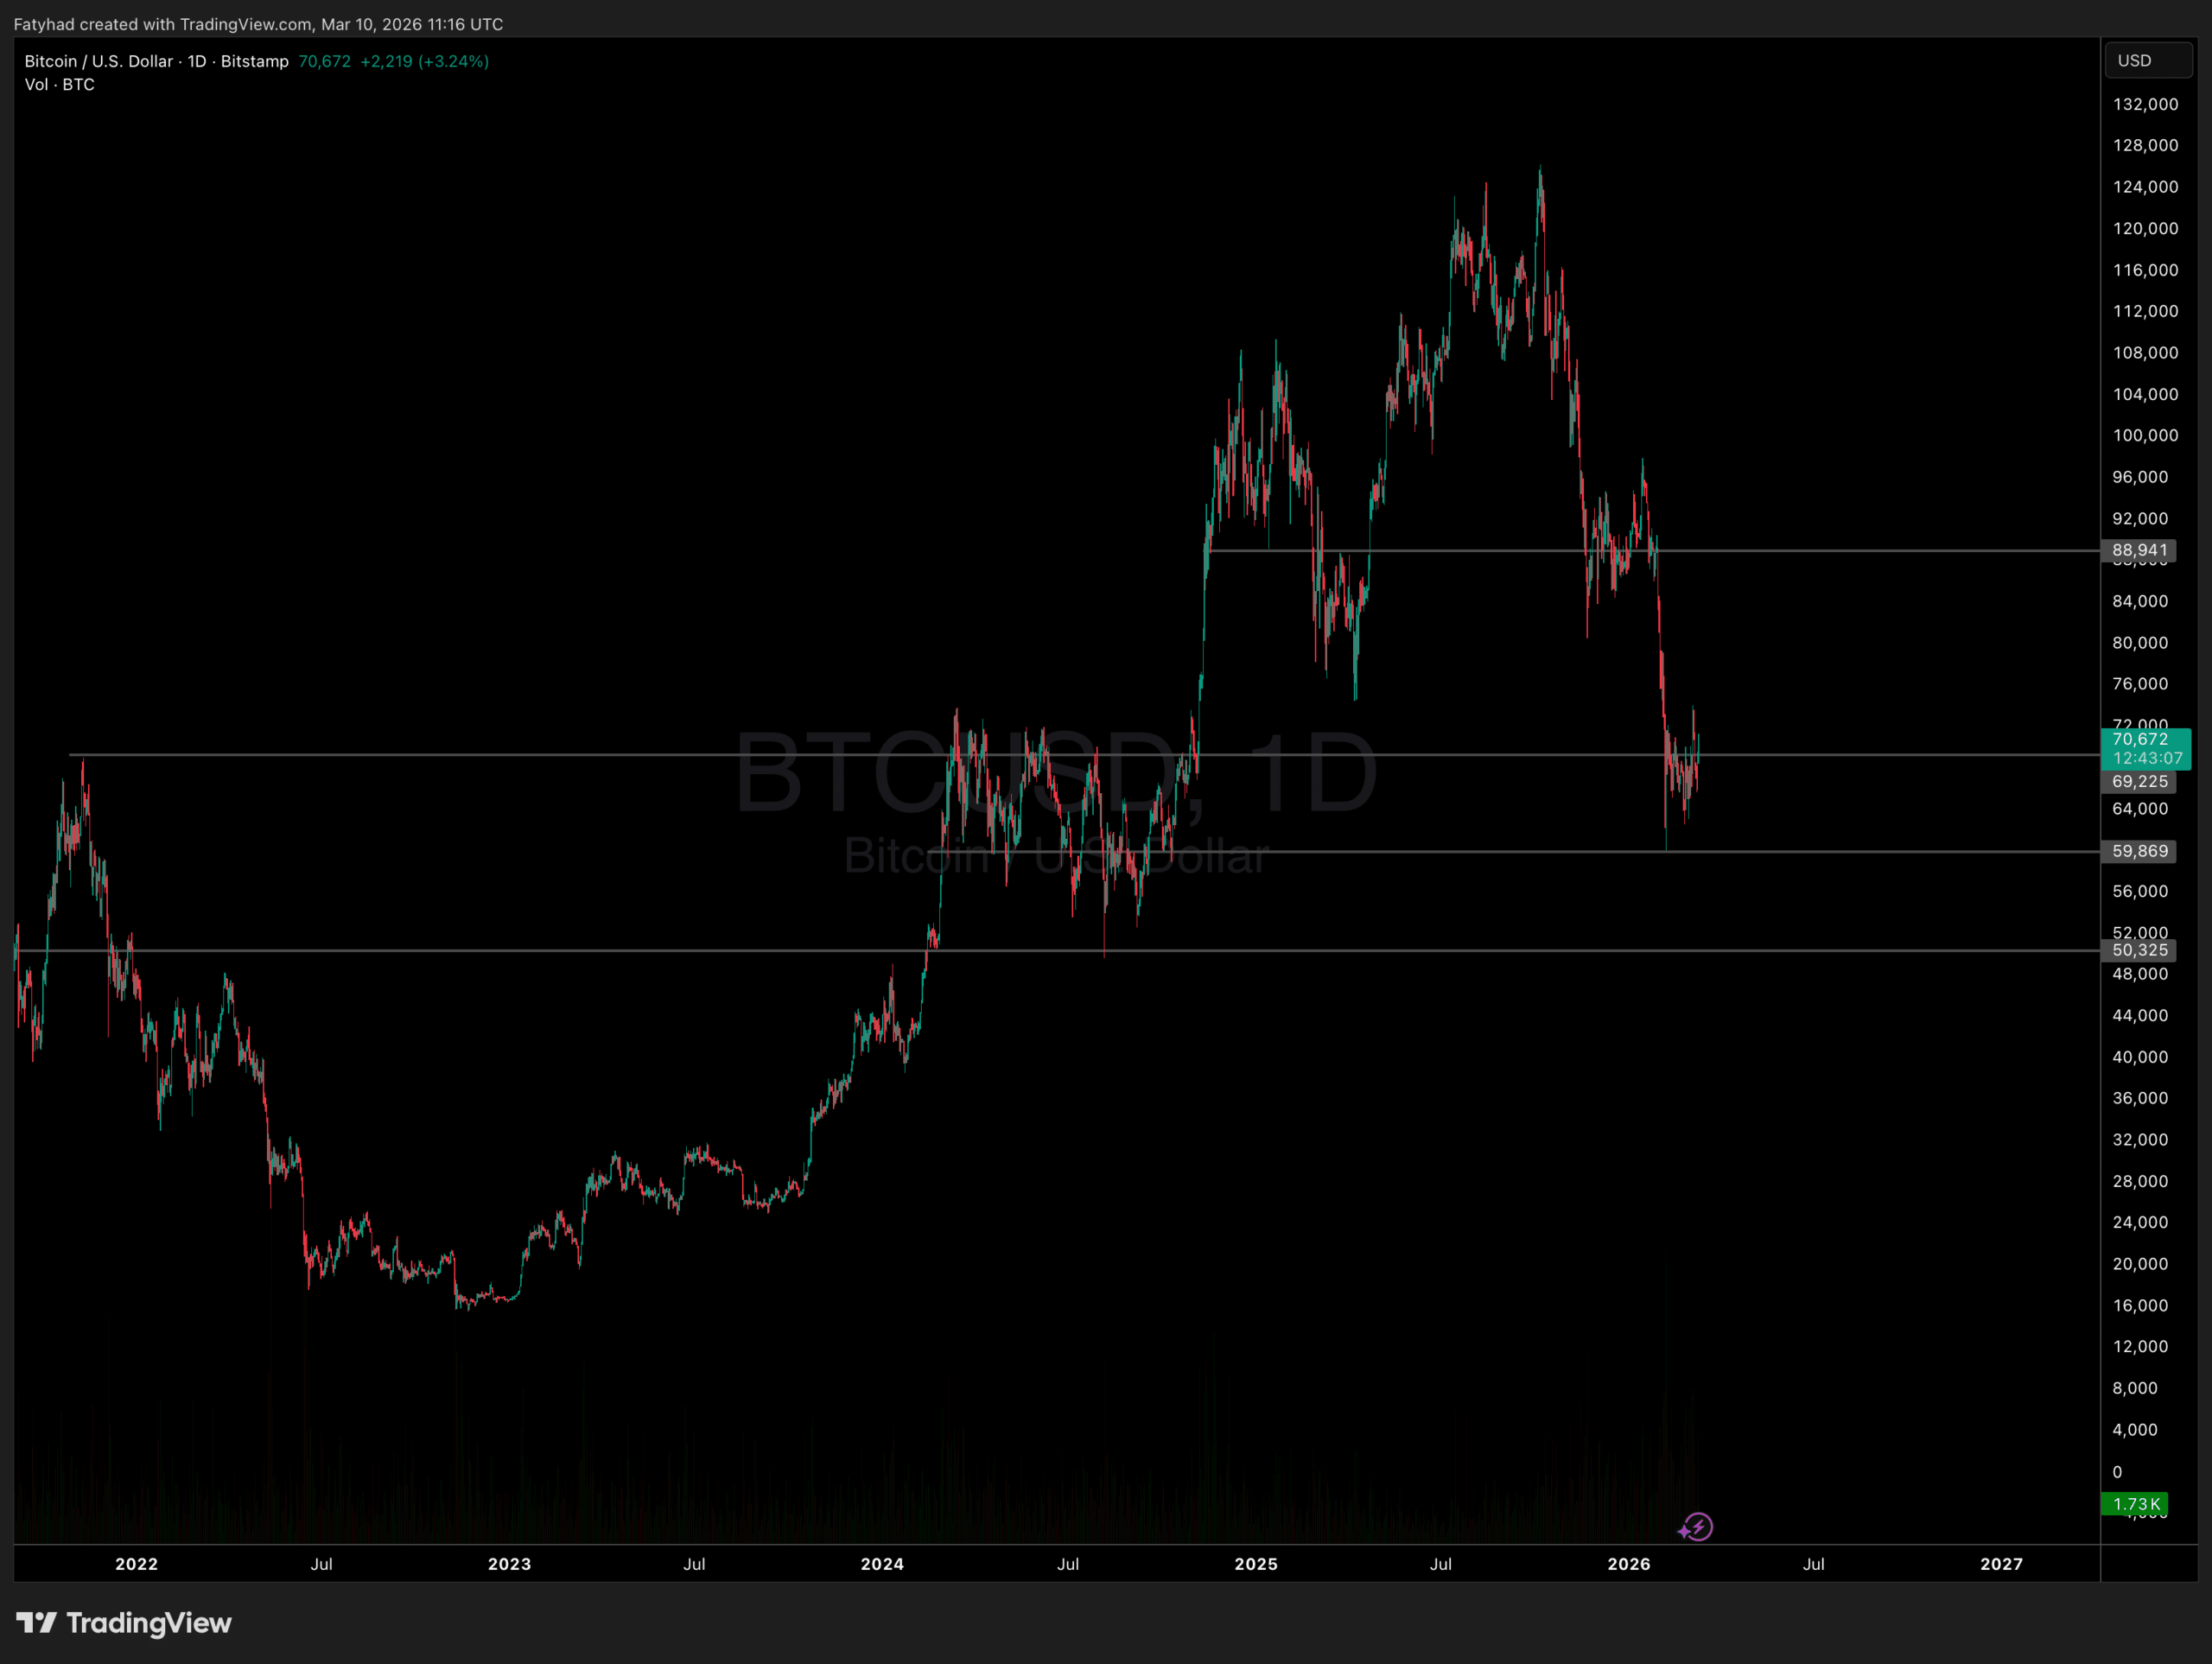
Bitcoin Price Analysis Source: TradingView
Trump’s claim helped Bitcoin firmly reclaim the $69,000-$70,000 level, effectively invalidating the short-term bearish divergence that had threatened to drag the asset significantly lower over the volatile weekend trading session.
This isn’t a confirmation yet. Traders are actively identifying $71,200 as the primary overhead resistance level that bulls must decisively reclaim to fully confirm a return to a true price discovery phase. On the downside, maintaining the $68,000 psychological threshold remains deeply critical to defending the asset against any sudden reversals. Such pullbacks could easily be triggered by unexpected geopolitical flare-ups or mixed signals during the administration’s scheduled situation updates.
EXPLORE: Bitcoin and Stocks Stabilize as Bond Market Signals Risk-Off
Traditional Markets React: Nasdaq and S&P 500 Catch Relief Bid
As the New York market closed, the risk-on theme continued to push traditional equities, which helped keep the crypto market climbing. The Nasdaq Composite, which is tech-heavy, went up by 1.25%, and the S&P 500 index finished the day 0.8% higher after a bit of a rollercoaster.
Even though the market is looking pretty good, there are still some important problems that need to be sorted out. For example, the European alliance is not as strong as it used to be, especially with disagreements about who gets to use the base in Spain and the United Kingdom. This makes it harder to move things around. The Strait of Hormuz, a crucial shipping route, remains contested, which will likely continue to cause shipping disruptions.
Until we know for sure that war is over and what the final outcome will be, the current rise in crypto and traditional stocks depends on things staying calm in the global energy markets.
DISCOVER: What is the Next Crypto to Explode in 2026?
nextThe post Bitcoin Price Reclaims $70,000 As Trump Declares Possible End To Iran War appeared first on Coinspeaker.
You May Also Like

Husky Inu (HINU) Completes Move To $0.00020688

Cryptos Signal Divergence Ahead of Fed Rate Decision
