

Silver Price Alert: Pump-Then-Dump May Guide Metals in 2026
Silver started 2026 on fire. The metal gained over 60% in January, briefly touching $120 per ounce. By June, all those gains had vanished. Silver is now negative for the year, trading near $68.
Bloomberg Intelligence senior commodity strategist Mike McGlone shared a chart on X showing the reversal. His warning: silver’s pump‑then‑dump may be front‑running the entire metals sector.
McGlone’s Tweet and Chart
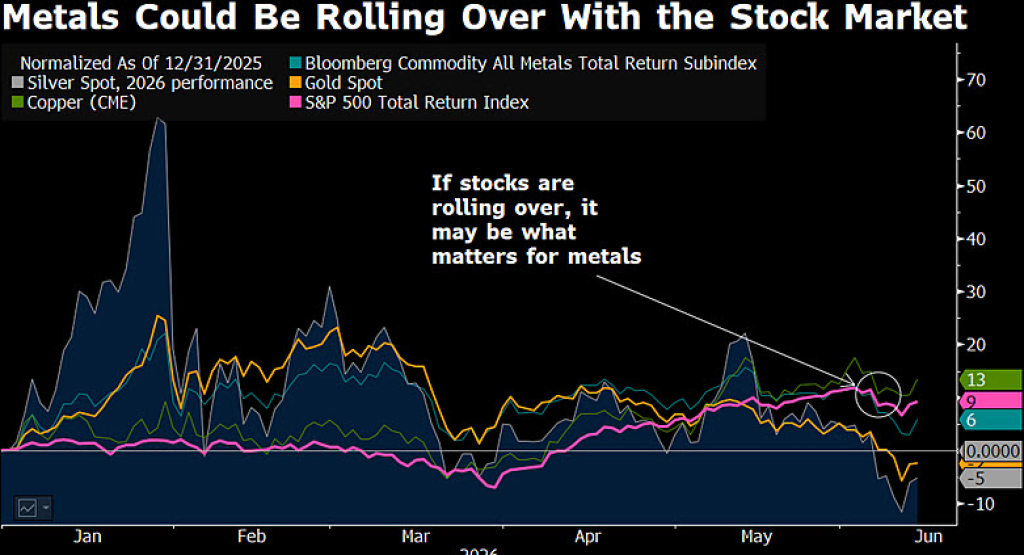
McGlone tweeted on June 8 that silver’s sharp reversal from a 60%+ gain to a year‑to‑date loss could signal pressure on gold and other risk assets. He pointed out that the Bloomberg Commodity All Metals Total Return Subindex (BCOMAMT) is up only 6% in 2026, compared to 9% for the S&P 500 total return through June 12. But at its January high, the metals index had extended 22%.
His attached chart normalizes performance from December 31, 2025. The lines tell a clear story. Through January, silver (orange line) shot up more than 60%, gold (yellow) climbed steadily, copper (gray) rose, and the all‑metals index (blue) peaked near +22%. Meanwhile, the S&P 500 (purple) barely moved.
Then the lines converged. By late spring, silver had dropped into negative territory, gold fell back to single‑digit gains, and copper and the metals index rolled over. The S&P 500 now leads them all at +9%.
 Source: X/@mikemcglone11
McGlone highlighted that BCOMAMT’s 180‑day volatility is 2.2 times that of the S&P 500 – the highest since 2007. The historical average is closer to 1‑to‑1. That extreme volatility, combined with the rapid price rise, often signals a peak. When prices rally that fast, deficits can shift to surpluses, setting enduring highs.
He concluded: “If stocks are rolling over, it may be what matters for metals.”
Read also: Why Silver and Gold Price Crashes Shouldn’t Worry Holders
Silver Chart Analysis: 30 Days of Pain
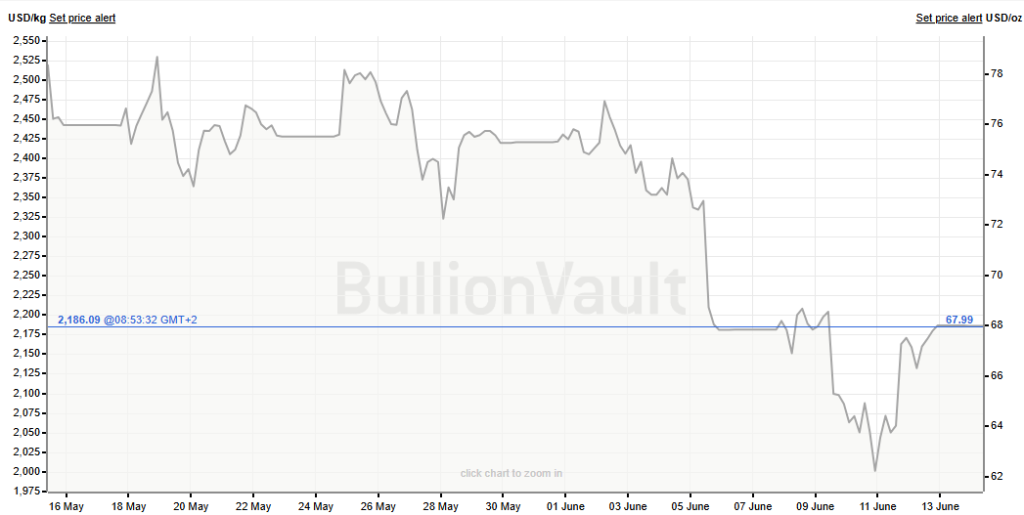
The second chart from BullionVault shows silver’s price action from May 16 to June 13, 2026.
Silver opened that period near $70. It rallied to a high around $76 in late May, briefly touching the 50‑day moving average. But buyers could not hold the level. Each rally attempt was met with sellers.
From June 1 onward, the downtrend accelerated. Silver broke below $70, then below $68. By June 13, it traded near $66.50. The 200‑day moving average sits near $64 – the last major support before the $60 psychological level.
 Source: BullionVualt
Volume patterns on the chart show heavier selling on down days, confirming institutional distribution. The 50‑day moving average (near $72) has acted as hard resistance. Until silver reclaims that level, the trend remains down.
Silver Price Forecast
McGlone’s framework indicates metals may have already peaked for this cycle. The correlation with stocks is tight. If the S&P 500 continues to slide, the silver price will likely follow.
Key levels to watch:
- Immediate support: $64 (200‑day moving average). A daily close below this opens the door to $60.
- Next support: $60 psychological level. Below that, $55‑$58 is possible.
- Resistance: $72 (50‑day moving average). Silver needs to close above this to stabilize.
- Bullish reversal trigger: A weekly close above $75 would break the downtrend.
Short‑term forecast (next 1‑2 weeks): Silver will likely test $64‑$65. If that holds, a relief bounce toward $70 could follow. If $64 breaks, expect a quick move to $60.
Medium‑term (rest of 2026): McGlone’s base case is that metals revert lower, driven by rising US energy dominance and technology. He sees $50 as a possible target if the stock market rolls over hard. The bullish alternative: the S&P 500 resumes its uptrend and lifts all boats, pushing silver back toward $75.
Our Take
McGlone has been early before, but his logic is sound. Silver’s 60% pump in January was extreme. The subsequent dump has erased all those gains. High volatility and a tight stock correlation are warning signs.
For short‑term traders, $64 is the line. For long‑term holders, a break below $60 would offer a better risk‑reward entry. But until stocks find their footing, silver remains vulnerable.
Subscribe to our YouTube channel for daily crypto updates, market insights, and expert analysis.
The post Silver Price Alert: Pump-Then-Dump May Guide Metals in 2026 appeared first on CaptainAltcoin.


Du kan måske også lide

King Charles marks official birthday with Trooping the Colour spectacle of pomp, pageantry and tradition

Jangan main sentimen pertembungan antara kerajaan, Umno tegur Loke

PMI-ACP Exam Preparation: How to Use a Simulator and Practice Questions Effectively


Trendene nyheder
Mere
